Unlock a world of possibilities! Login now and discover the exclusive benefits awaiting you.
- Qlik Community
- :
- Forums
- :
- Analytics
- :
- New to Qlik Analytics
- :
- bar chart and line chart together
Options
- Subscribe to RSS Feed
- Mark Topic as New
- Mark Topic as Read
- Float this Topic for Current User
- Bookmark
- Subscribe
- Mute
- Printer Friendly Page
Turn on suggestions
Auto-suggest helps you quickly narrow down your search results by suggesting possible matches as you type.
Showing results for
Contributor III
2018-02-20
05:41 AM
- Mark as New
- Bookmark
- Subscribe
- Mute
- Subscribe to RSS Feed
- Permalink
- Report Inappropriate Content
bar chart and line chart together
Hello,
I have one question. I want the graph like this
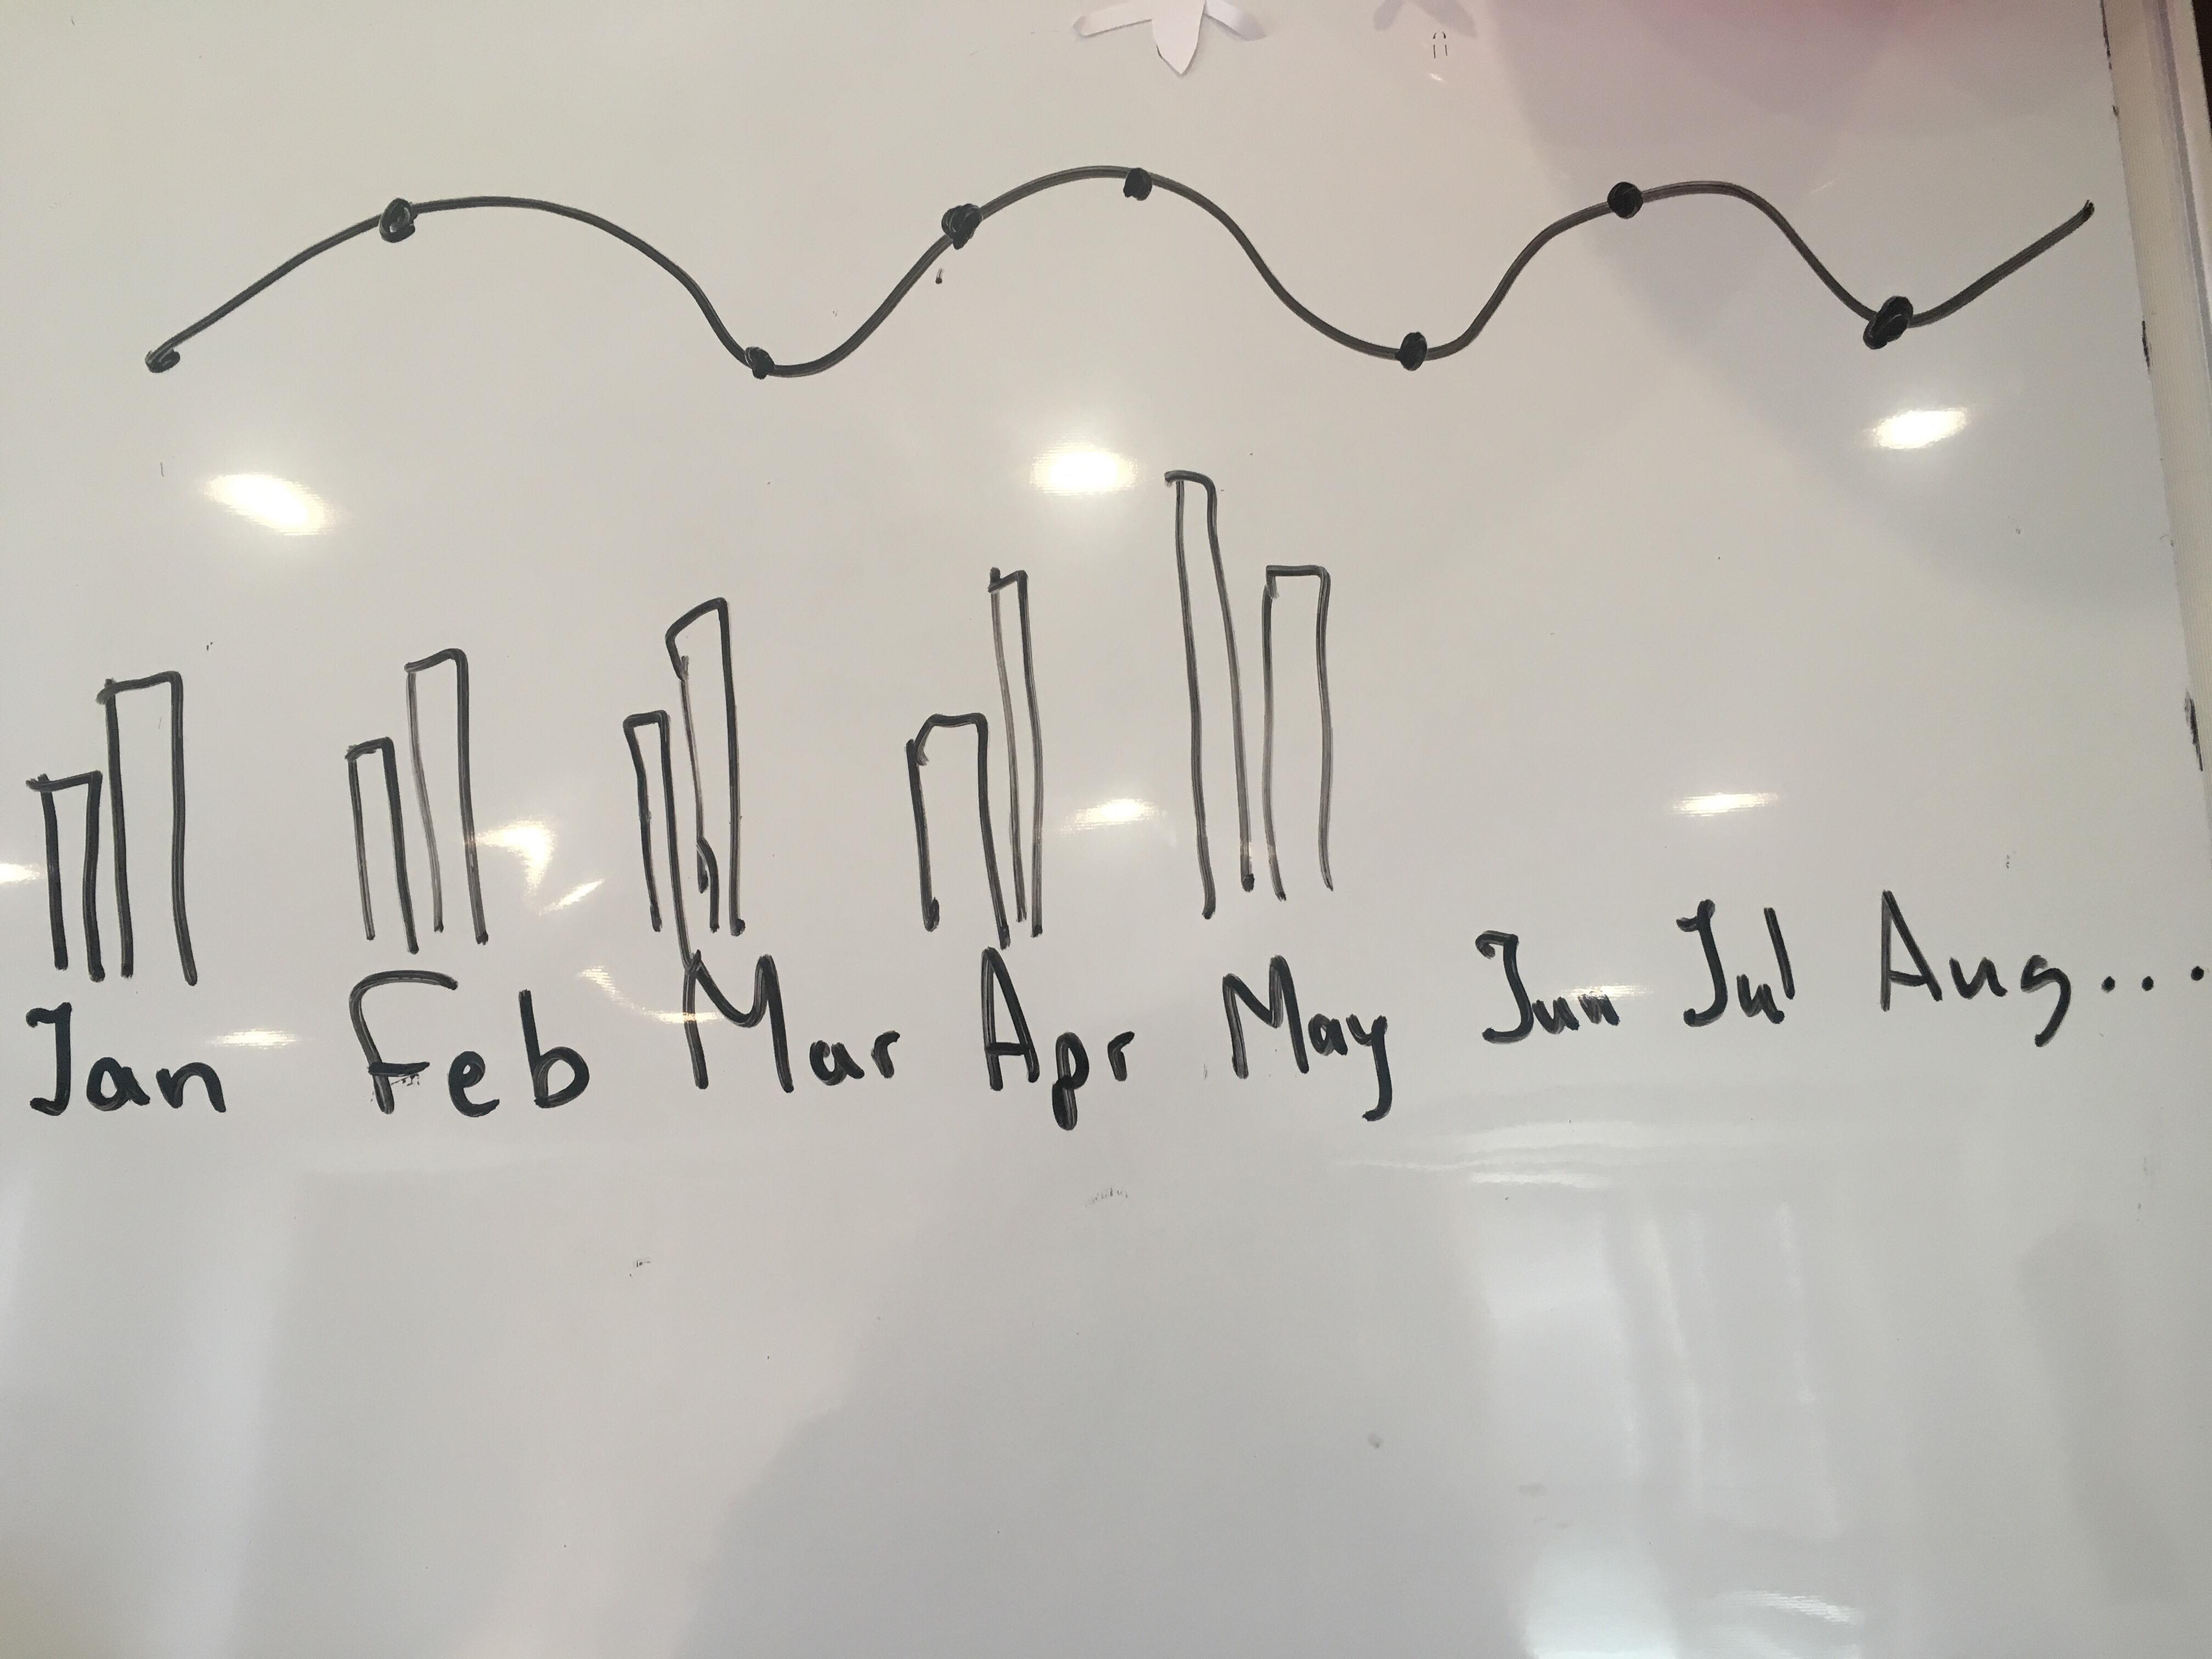
Line chart should be the sum of the sales for the whole Year.
And Bar chart should be like this: In January second chart should be current year and first chart should be the previous and it will show the sum for the same companies. Also, In February too and etc.
Then, i want to have a drill-down on them. When I select January , all dates of the january should be shown and every date should have the comparison chart to the previous date( as it was in months)
Can someone help me?
181 Views
0 Replies
Community Browser