Unlock a world of possibilities! Login now and discover the exclusive benefits awaiting you.
- Qlik Community
- :
- Forums
- :
- Analytics
- :
- New to Qlik Analytics
- :
- best visualization to show "trend" of non-quantita...
- Subscribe to RSS Feed
- Mark Topic as New
- Mark Topic as Read
- Float this Topic for Current User
- Bookmark
- Subscribe
- Mute
- Printer Friendly Page
- Mark as New
- Bookmark
- Subscribe
- Mute
- Subscribe to RSS Feed
- Permalink
- Report Inappropriate Content
best visualization to show "trend" of non-quantitative measure values
I am working in Qlik Sense 3.2. I am trying to show a "trend" of a non-quantitative measure values. The measure is for a field that has one of two values -- 'pass' or 'fail'. The dimension is a date field. I would normally use a line or bar chart for this situation, and I know that I can map the two non-quantitative measure values to quantitative values (e.g., 1/0). However, the user does not want to mentally transform the numerical measure values back to the original non-quantitative values. He / she wants the visualization to simply show some icon (e.g., a bar, or a point) that is associated to the measure values "pass" and "fail" for each date. How can I achieve this?
- Tags:
- qlik_sense_3.2.1
Accepted Solutions
- Mark as New
- Bookmark
- Subscribe
- Mute
- Subscribe to RSS Feed
- Permalink
- Report Inappropriate Content
I would think a simple bar chart would do nicely.
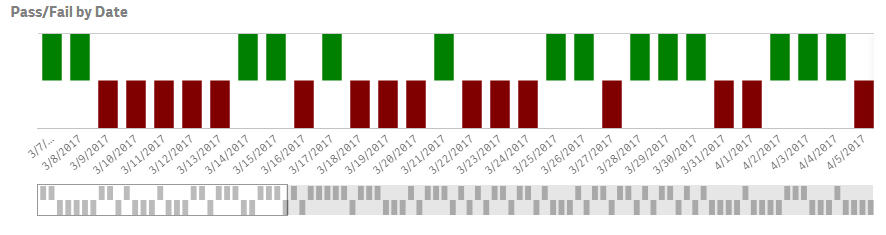
The new distribution charts in the June 2017 Release might be interesting as well.
-Rob
- Mark as New
- Bookmark
- Subscribe
- Mute
- Subscribe to RSS Feed
- Permalink
- Report Inappropriate Content
I would think a simple bar chart would do nicely.
The new distribution charts in the June 2017 Release might be interesting as well.
-Rob
- Mark as New
- Bookmark
- Subscribe
- Mute
- Subscribe to RSS Feed
- Permalink
- Report Inappropriate Content
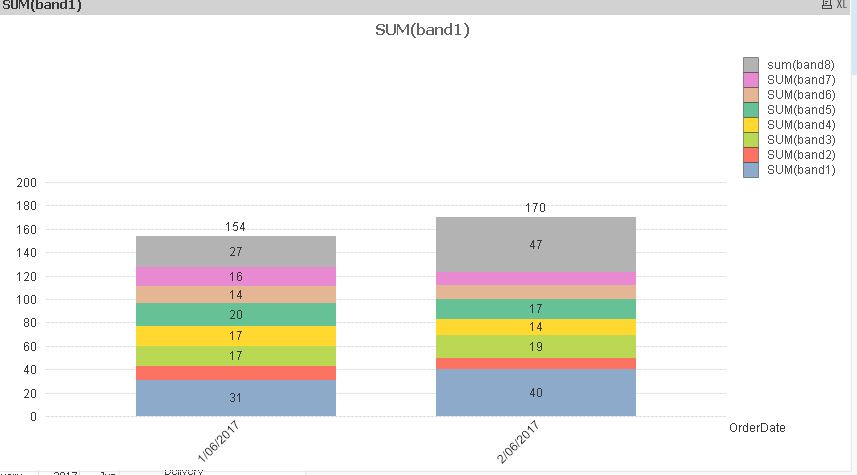
Is there somewhere where I can find interesting ways of showing this type of data? I have a situation where the business makes appointments for treatment - treatment then starts some time after. The problem is that some people are waiting quite some time and administrators need to "see" the problem and then try and address it - if the wait could be predicted that would be "the holy grail". I have already done a stacked bar graph that counts the number of people waiting in bands of 10 mins ... looks something like this ... showing that on June 2, 40 people waited for 10 mins etc,but I am looking for ideas perhaps using the other types of default charts in Qlikview.
Jo
- Mark as New
- Bookmark
- Subscribe
- Mute
- Subscribe to RSS Feed
- Permalink
- Report Inappropriate Content
It's an interesting data set. A couple of thoughts. I would divide the problem into "insights" and "KPIs". For the insights I would try a gaant chart showing each individual and the time they waited. That might show patterns, outliers and choke points at certain times of the day.
For KPIs, I would calculate something like "90% of the people were seen in x minutes". I assume you already have the wait time for each person so using the Fractile(waittime, .n) might produce some interesting statistics, particularly if plotted over time, provider or treatment type.
An hourly box-plot might be insightful as well.
Do you have some sample data? I'd like to take a crack at it if I can find the time.
-Rob
- Mark as New
- Bookmark
- Subscribe
- Mute
- Subscribe to RSS Feed
- Permalink
- Report Inappropriate Content
Hi Rob
I am going to try some of your suggestions. The 90th percentile is a good idea. I will also ignore arrival time to start time and just look at Apt to Start.
I am not able to send a file through on this interface? I will try from the email sent.
Thank you for your help
Jo
- Mark as New
- Bookmark
- Subscribe
- Mute
- Subscribe to RSS Feed
- Permalink
- Report Inappropriate Content
Hi Rob
I have just done a Gannt Chart but then realised I did not give you enough data. Also that for exploring purposes we only need data for 1 day.
I could not send the data from the interface - maybe because I jumped in on another discussion? Let me know how to do this and I will re send.
I also used Mark Donovan's link to figure out how to use a Gannt Chart in Qlikview.
https://youtu.be/rcufeWouaNI?list=PL_MZdEB4lwqxxZLE7dOzIyGg_99qUzViz
The Gannt Chart works a treat - because I can then cut the data also based on resources.
Thank you again.
Jo
- Mark as New
- Bookmark
- Subscribe
- Mute
- Subscribe to RSS Feed
- Permalink
- Report Inappropriate Content
Glad to hear you are getting good results.
You can attach a file to your post by first clicking the link "Use advanced editor" in the reply window. Then an "attach" link will become available in the lower right of the reply window.
-Rob