Unlock a world of possibilities! Login now and discover the exclusive benefits awaiting you.
- Qlik Community
- :
- Forums
- :
- Analytics
- :
- New to Qlik Analytics
- :
- color by expression - QlikSense
- Subscribe to RSS Feed
- Mark Topic as New
- Mark Topic as Read
- Float this Topic for Current User
- Bookmark
- Subscribe
- Mute
- Printer Friendly Page
- Mark as New
- Bookmark
- Subscribe
- Mute
- Subscribe to RSS Feed
- Permalink
- Report Inappropriate Content
color by expression - QlikSense
Hi all,
i am struggeling with a simple line chart. It shows revenue over month - so "Month" would be one dimension. It has two expressions. The one calculates revenue for the current year. The other calculates revenue for the previous year. All no problem.
What i want - and until now couldnt get to: I want the line representing the current year to have a specific color (lets say, red) and the line representing the previous year to have another specific color (lets say, gray).
Can anyone help and explain how this can be done in SENSE ?
Thanks!
K
- Mark as New
- Bookmark
- Subscribe
- Mute
- Subscribe to RSS Feed
- Permalink
- Report Inappropriate Content
Nice work Steve! I tried this out and it worked fine. Pity picking a colour for a measure is so hard though.
- Mark as New
- Bookmark
- Subscribe
- Mute
- Subscribe to RSS Feed
- Permalink
- Report Inappropriate Content
Hi Steve,
Is this also possible for a combo chart? Because I can not create a second dimension in a combo chart, the Synthetic Dimension does not seem to be an option here.
- Mark as New
- Bookmark
- Subscribe
- Mute
- Subscribe to RSS Feed
- Permalink
- Report Inappropriate Content
Hi Joost,
You cannot apply this method to the combo chat - see Combo chart seperate colours by expression
You can adjust the colours by re-ordering the measures
Or play around adding empty measures
- Mark as New
- Bookmark
- Subscribe
- Mute
- Subscribe to RSS Feed
- Permalink
- Report Inappropriate Content
Hi Steve,
Is there a way to display legends for my chart when i use "color by expression" option in qlik sense.
How can i achieve it with the above illustration??
- Mark as New
- Bookmark
- Subscribe
- Mute
- Subscribe to RSS Feed
- Permalink
- Report Inappropriate Content
Hi Janani,
There is currently no Legend option for color by expression. I have seen apps where an image has been created to display the legend. This does give you the ability to customise the look.
- Mark as New
- Bookmark
- Subscribe
- Mute
- Subscribe to RSS Feed
- Permalink
- Report Inappropriate Content
Thanks Steve! I think this should help for now
- Mark as New
- Bookmark
- Subscribe
- Mute
- Subscribe to RSS Feed
- Permalink
- Report Inappropriate Content
Great job!! Thanks a lot.
Tobias
- Mark as New
- Bookmark
- Subscribe
- Mute
- Subscribe to RSS Feed
- Permalink
- Report Inappropriate Content
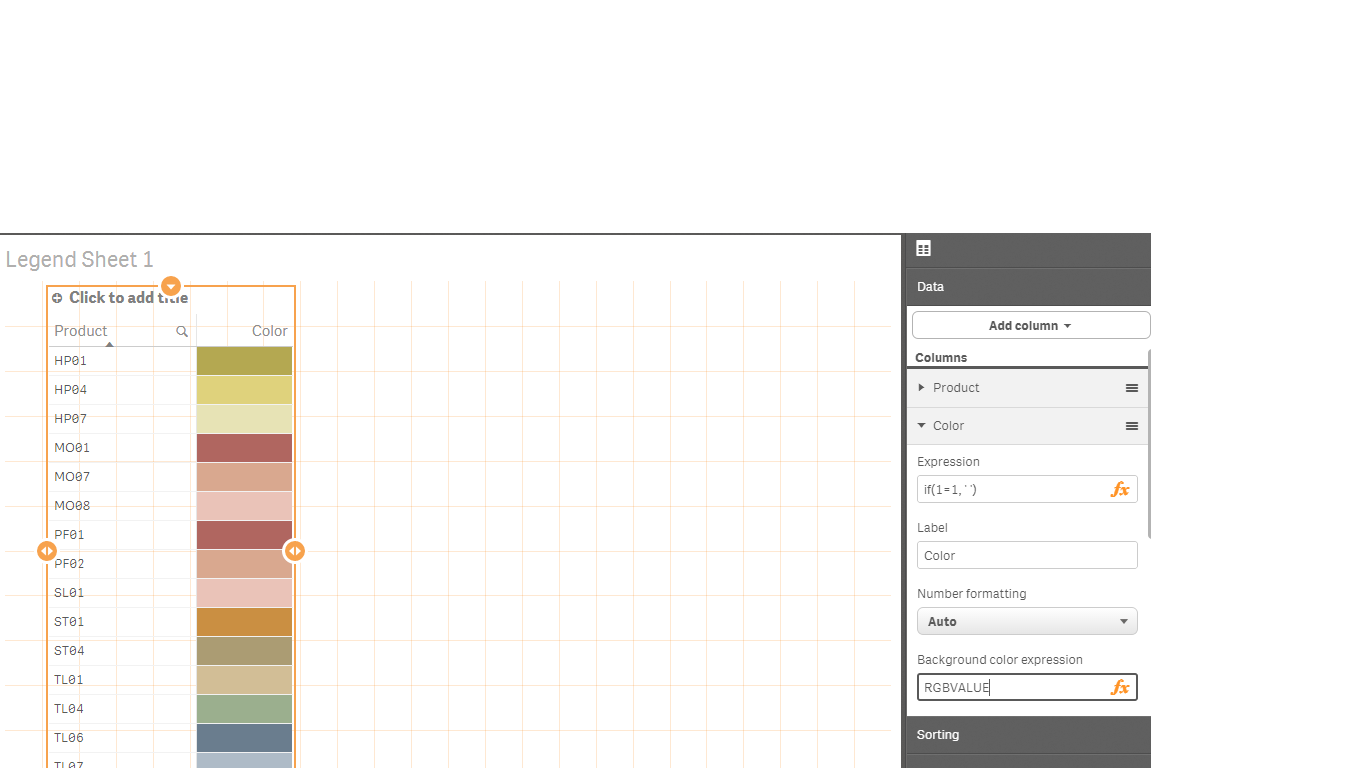
By using a table i managed to show legends when color by expression was used.
My excel data has a column 'RGBVALUE' - this holds the RGB value against each row. 
- Mark as New
- Bookmark
- Subscribe
- Mute
- Subscribe to RSS Feed
- Permalink
- Report Inappropriate Content
Good work! You might be interested in seeing how I extended this previously to create selectable color themes- Color Logic – loading multiple Color schemes
- Mark as New
- Bookmark
- Subscribe
- Mute
- Subscribe to RSS Feed
- Permalink
- Report Inappropriate Content
Hello Steve,
Further to your solution.
I used ValueList the way you said and it really worked .
The problem is when I do selection model of the month, for example, the specific month stay in the right color and the rest of the line becomes the color of the second line.
Do you have a solution for this?
Thanks a lot,
gal