Unlock a world of possibilities! Login now and discover the exclusive benefits awaiting you.
- Qlik Community
- :
- Forums
- :
- Analytics
- :
- New to Qlik Analytics
- :
- creating a line graph
Options
- Subscribe to RSS Feed
- Mark Topic as New
- Mark Topic as Read
- Float this Topic for Current User
- Bookmark
- Subscribe
- Mute
- Printer Friendly Page
Turn on suggestions
Auto-suggest helps you quickly narrow down your search results by suggesting possible matches as you type.
Showing results for
Not applicable
2014-12-15
05:16 PM
- Mark as New
- Bookmark
- Subscribe
- Mute
- Subscribe to RSS Feed
- Permalink
- Report Inappropriate Content
creating a line graph
Hello - I am new to Qlik Sense and trying to create a line graph measuring revenue by month. I am unable to align month on the y-axis as hoping. Is there something I am missing?
2,164 Views
- « Previous Replies
-
- 1
- 2
- Next Replies »
11 Replies
Partner Ambassador
2014-12-17
05:36 PM
- Mark as New
- Bookmark
- Subscribe
- Mute
- Subscribe to RSS Feed
- Permalink
- Report Inappropriate Content
as far a i know this is not possible with QlikSense!
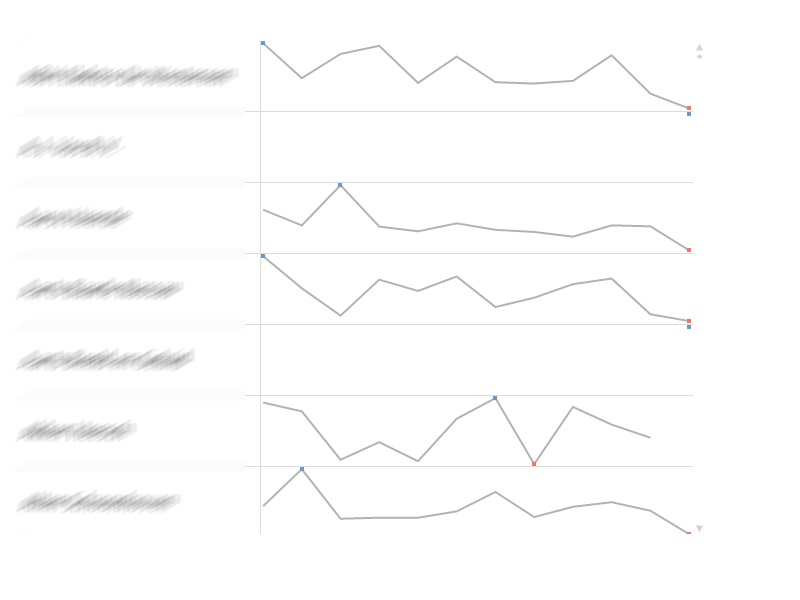
In QV11.20 you could make a table with your expression as a minichart
89 Views
Partner Ambassador/MVP
2014-12-17
10:39 PM
- Mark as New
- Bookmark
- Subscribe
- Mute
- Subscribe to RSS Feed
- Permalink
- Report Inappropriate Content
Or you could use a Trellis in QlikView. But like Jochem said, not sure it's possible in Sense.
-Rob
89 Views
- « Previous Replies
-
- 1
- 2
- Next Replies »
Community Browser