Unlock a world of possibilities! Login now and discover the exclusive benefits awaiting you.
- Qlik Community
- :
- Forums
- :
- Analytics
- :
- New to Qlik Analytics
- :
- Re: creating pie chart choosing multiple column
- Subscribe to RSS Feed
- Mark Topic as New
- Mark Topic as Read
- Float this Topic for Current User
- Bookmark
- Subscribe
- Mute
- Printer Friendly Page
- Mark as New
- Bookmark
- Subscribe
- Mute
- Subscribe to RSS Feed
- Permalink
- Report Inappropriate Content
creating pie chart choosing multiple column
Hi,
wondering do you have any suggestion creating a pie chart using multiple column without change the data structure
Having data structure like this, need to create other dashboard so can not change the structure :
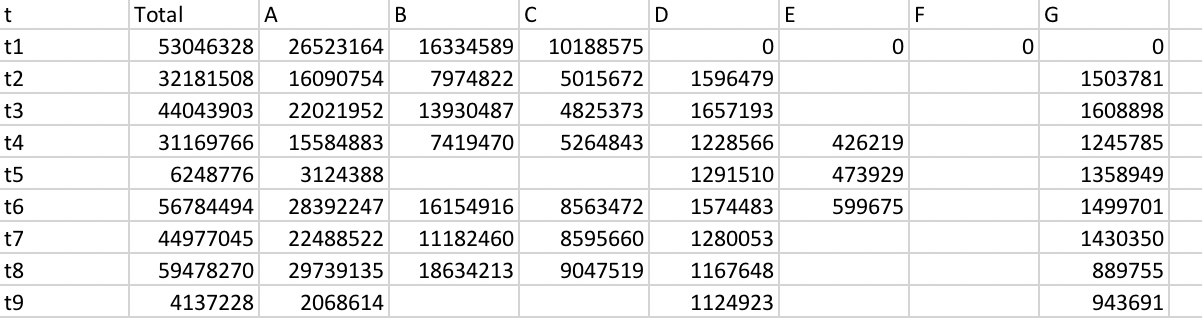
Each row are each individual haveing A--G costs. and Total =sum(A:G) --Total is total cost
is there any chance can create pie chart for each individual t1, t2.....(will use filter for this so only need one pie chart)
showing the decomposition of the Total cost. So we do not need the total cost but have A:G in the same pie chart and see the %
here is the data (in the second sheet: name 'sheet 1')
Thank you.
- « Previous Replies
-
- 1
- 2
- Next Replies »
Accepted Solutions
- Mark as New
- Bookmark
- Subscribe
- Mute
- Subscribe to RSS Feed
- Permalink
- Report Inappropriate Content
You can, but it would be nicer to change ur data structure..
What u can do without altering ur table is :
as dimension:
ValueList('B','C','D','E','F','G')
as a measure:
if(ValueList('B','C','D','E','F','G')='B', sum(B),
if(ValueList('B','C','D','E','F','G')='C', sum(C),
if(ValueList('B','C','D','E','F','G')='D', sum(D),
if(ValueList('B','C','D','E','F','G')='E', sum(E),
if(ValueList('B','C','D','E','F','G')='F', sum(F),
if(ValueList('B','C','D','E','F','G')='G', sum(G)
))))))
- Mark as New
- Bookmark
- Subscribe
- Mute
- Subscribe to RSS Feed
- Permalink
- Report Inappropriate Content
Hi,
See if the attached works for you.
Thanks,
RT
- Mark as New
- Bookmark
- Subscribe
- Mute
- Subscribe to RSS Feed
- Permalink
- Report Inappropriate Content
H Rajesh,
Thank you. But this is not what I want.
what I want is
the Pie showing the proportion of B to G (with out A)
because B:G are columns instead of Row so I do not know how to create this pie.
you can have this pie for all the t. or only one single t
but showing the decomposition of how B,C,D,E,F,G to the sum(B,C,D,E,F,G)
Thank you!
- Mark as New
- Bookmark
- Subscribe
- Mute
- Subscribe to RSS Feed
- Permalink
- Report Inappropriate Content
You can, but it would be nicer to change ur data structure..
What u can do without altering ur table is :
as dimension:
ValueList('B','C','D','E','F','G')
as a measure:
if(ValueList('B','C','D','E','F','G')='B', sum(B),
if(ValueList('B','C','D','E','F','G')='C', sum(C),
if(ValueList('B','C','D','E','F','G')='D', sum(D),
if(ValueList('B','C','D','E','F','G')='E', sum(E),
if(ValueList('B','C','D','E','F','G')='F', sum(F),
if(ValueList('B','C','D','E','F','G')='G', sum(G)
))))))
- Mark as New
- Bookmark
- Subscribe
- Mute
- Subscribe to RSS Feed
- Permalink
- Report Inappropriate Content
Hi,
Is this what you want?
Thanks,
RT
- Mark as New
- Bookmark
- Subscribe
- Mute
- Subscribe to RSS Feed
- Permalink
- Report Inappropriate Content
Yes. That is.
- Mark as New
- Bookmark
- Subscribe
- Mute
- Subscribe to RSS Feed
- Permalink
- Report Inappropriate Content
Hi Omar,
thank you could I create a 'new dimension' use the expression you suggested
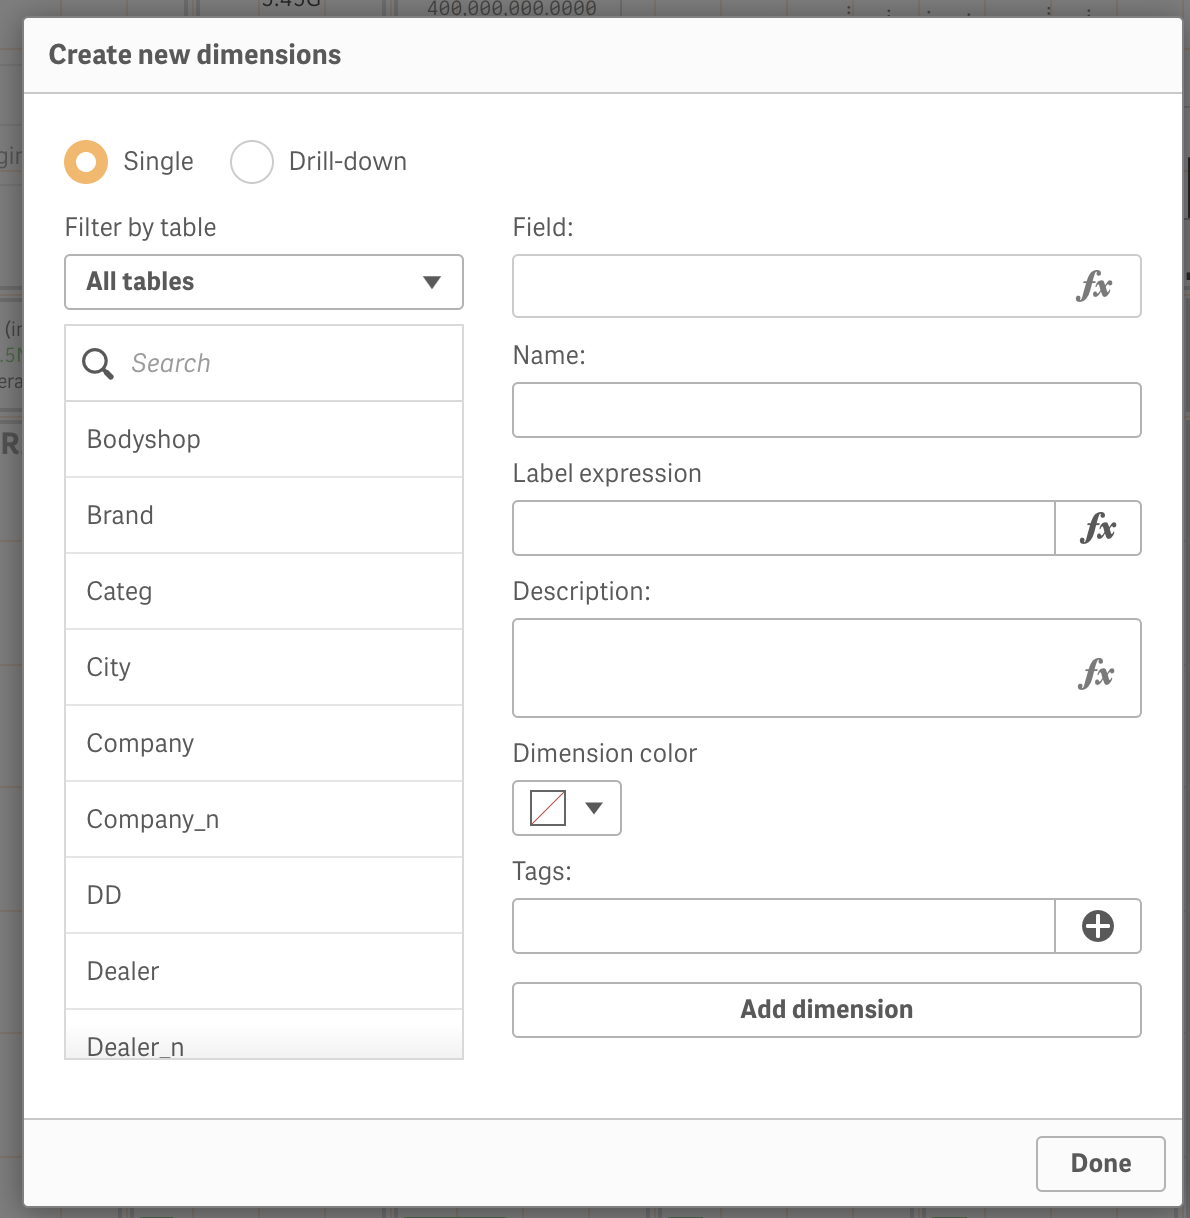
and I will put in the Field area the function:
ValueList('B','C','D','E','F','G')
one question here is what the different using g ' ', and [ ]
I was using fx insert, then I got this
ValueList([B],
Thank you!
- Mark as New
- Bookmark
- Subscribe
- Mute
- Subscribe to RSS Feed
- Permalink
- Report Inappropriate Content
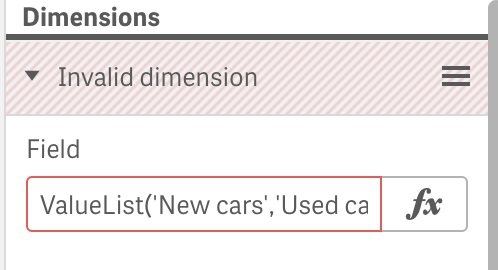
Seems not working
I have my real data title as
and I put the ValueList() dimention, it says not valid
- Mark as New
- Bookmark
- Subscribe
- Mute
- Subscribe to RSS Feed
- Permalink
- Report Inappropriate Content
Hi Rajesh,
I copied your expression from the file to my real one and change the A,B,C,D to the name in my dataset.
have this
but I also get a the this --the red frame (seems something wrong)
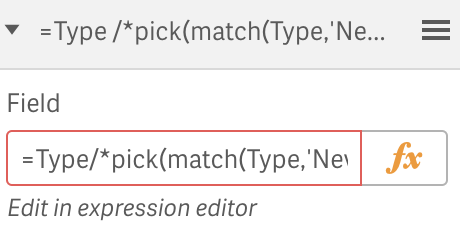
any suggestion?
=Type
/*pick(match(Type,'New cars','Used cars','Service','Other Service','Spare parts','Bodyshop')
,New cars
,Used cars
,Service
,Other Service
,Spare parts
,Bodyshop
)
)*/
- Mark as New
- Bookmark
- Subscribe
- Mute
- Subscribe to RSS Feed
- Permalink
- Report Inappropriate Content
can u click on the fx and let me see how it's written?
- « Previous Replies
-
- 1
- 2
- Next Replies »