Unlock a world of possibilities! Login now and discover the exclusive benefits awaiting you.
- Qlik Community
- :
- Forums
- :
- Analytics
- :
- New to Qlik Analytics
- :
- Re: customized title in charts
- Subscribe to RSS Feed
- Mark Topic as New
- Mark Topic as Read
- Float this Topic for Current User
- Bookmark
- Subscribe
- Mute
- Printer Friendly Page
- Mark as New
- Bookmark
- Subscribe
- Mute
- Subscribe to RSS Feed
- Permalink
- Report Inappropriate Content
customized title in charts
Hi Community
this is a QlikSense native chart whose title is very limited,I can not have different font style in a line
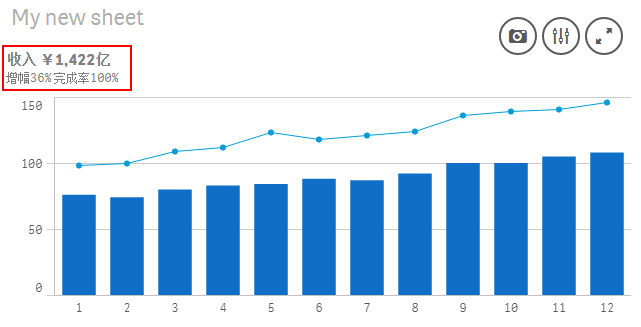
I need it to be more flexible, for example numbers in red color but others in black, "收入" in bold but others are not etc.
I think I have to achieve this by using extensions, can I invoke this native chart in js and just make a little change on title part?
what will the js code look like ? plz give some advice , thank you
- Mark as New
- Bookmark
- Subscribe
- Mute
- Subscribe to RSS Feed
- Permalink
- Report Inappropriate Content
anyone can help with this?
- Mark as New
- Bookmark
- Subscribe
- Mute
- Subscribe to RSS Feed
- Permalink
- Report Inappropriate Content
Hi Dave,
I don't think we can do that customization in the title of a chart. Instead, you could add a text box on top of the chart and make the colour and font changes there. Let me know if that was helpful. 
- Mark as New
- Bookmark
- Subscribe
- Mute
- Subscribe to RSS Feed
- Permalink
- Report Inappropriate Content
It's helpful but still I need a extension solution to make them in one object 🙂
- Mark as New
- Bookmark
- Subscribe
- Mute
- Subscribe to RSS Feed
- Permalink
- Report Inappropriate Content
Hi Dave, I'm not aware of an extension to customize chart titles. Is there a specific requirement for this? Because it shouldn't make a difference in the dashboard if you use the technique I suggested. The measures in the text box are dynamic and change according to filters.
- Mark as New
- Bookmark
- Subscribe
- Mute
- Subscribe to RSS Feed
- Permalink
- Report Inappropriate Content
I am going to embed my charts into web page using mashup, it will be perfect if I get only one object ID each chart. Your suggestion also works actually and can be plan B for me ,thanks Adwitiya
- Mark as New
- Bookmark
- Subscribe
- Mute
- Subscribe to RSS Feed
- Permalink
- Report Inappropriate Content
Yes, that would have been perfect. Hopefully they come up with this feature in future versions of Qlik Sense.
Please mark the answer as correct if it has helped you. We can close the thread then.