Unlock a world of possibilities! Login now and discover the exclusive benefits awaiting you.
- Qlik Community
- :
- Forums
- :
- Analytics
- :
- New to Qlik Analytics
- :
- Re: % difference Sales vs Targets
- Subscribe to RSS Feed
- Mark Topic as New
- Mark Topic as Read
- Float this Topic for Current User
- Bookmark
- Subscribe
- Mute
- Printer Friendly Page
- Mark as New
- Bookmark
- Subscribe
- Mute
- Subscribe to RSS Feed
- Permalink
- Report Inappropriate Content
% difference Sales vs Targets
Hi,
How can i calculate Actual Sales vs Target 2016 (i.e percentage difference)?
My column names in excel are: Total Sales and Total Target 2016.
I already have a bar chart on Qlik Sense which compares the sales rep performance but i would like it to show in the same column the difference in %. (whether that's a growth or decrease)
Alex
Accepted Solutions
- Mark as New
- Bookmark
- Subscribe
- Mute
- Subscribe to RSS Feed
- Permalink
- Report Inappropriate Content
Usually it's something like =num(sum([Actual Sales])/sum([Target 2016]) -1,'0.00%')
talk is cheap, supply exceeds demand
- Mark as New
- Bookmark
- Subscribe
- Mute
- Subscribe to RSS Feed
- Permalink
- Report Inappropriate Content
Usually it's something like =num(sum([Actual Sales])/sum([Target 2016]) -1,'0.00%')
talk is cheap, supply exceeds demand
- Mark as New
- Bookmark
- Subscribe
- Mute
- Subscribe to RSS Feed
- Permalink
- Report Inappropriate Content
Hi
You can also use the Gysbert Wassenaar's expression by adding symbols,
For Increase it shows up and for Decrease it shows down symbol.
Like this:
Num(Sum([Actual Sales])/Sum([Target 2016])-1, '▲ 0.0%;▼ 0.0%')
- Mark as New
- Bookmark
- Subscribe
- Mute
- Subscribe to RSS Feed
- Permalink
- Report Inappropriate Content
Thank you Satish.
How do i make the adding symbol and where do i write that expression?
Are there any other calculations you are aware of that will make my project shine?
- Mark as New
- Bookmark
- Subscribe
- Mute
- Subscribe to RSS Feed
- Permalink
- Report Inappropriate Content
Refer the attached app
Thanks
- Mark as New
- Bookmark
- Subscribe
- Mute
- Subscribe to RSS Feed
- Permalink
- Report Inappropriate Content
Satish,
I've used the expression and works great.
Num(Sum([Actual Sales])/Sum([Target 2016])-1, '▲ 0.0%;▼ 0.0%')
How can I put a red color when their targets are below 0%
- Mark as New
- Bookmark
- Subscribe
- Mute
- Subscribe to RSS Feed
- Permalink
- Report Inappropriate Content
Thank you,
I've used the expression, since I wanted to include an indicator as well and it's in the master file in measures:
Num(Sum([Actual Sales])/Sum([Target 2016])-1, '▲ 0.0%;▼ 0.0%')
How can I add red color if its negative and green color if its positive.
Alex
- Mark as New
- Bookmark
- Subscribe
- Mute
- Subscribe to RSS Feed
- Permalink
- Report Inappropriate Content
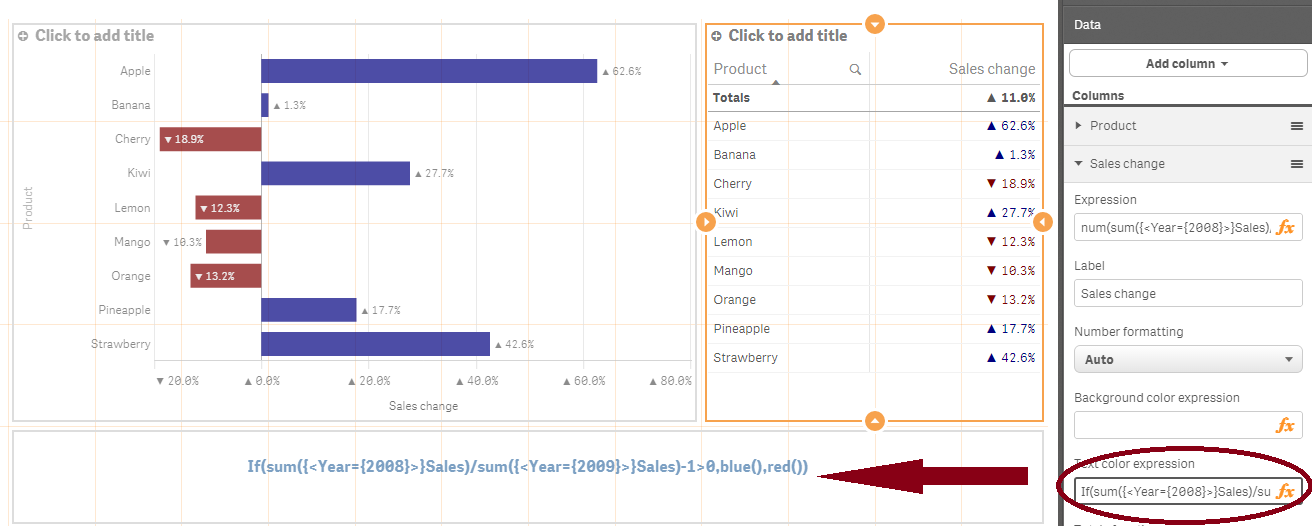
You can use the Text color expression setting of the measure. See the image below for an example":
talk is cheap, supply exceeds demand