Unlock a world of possibilities! Login now and discover the exclusive benefits awaiting you.
- Qlik Community
- :
- Forums
- :
- Analytics
- :
- New to Qlik Analytics
- :
- difference in counts
- Subscribe to RSS Feed
- Mark Topic as New
- Mark Topic as Read
- Float this Topic for Current User
- Bookmark
- Subscribe
- Mute
- Printer Friendly Page
- Mark as New
- Bookmark
- Subscribe
- Mute
- Subscribe to RSS Feed
- Permalink
- Report Inappropriate Content
difference in counts
Hi all,
I have attached a . qvf file. Please check and help me to create a master calendar for the date fields present in the tables.
I need to create a bar chart where it has 3 bars, and i need on weekly basis.
Dimension:
weekGroup
Measures:
1. Count of invitation_id
2. count of invitation_id where landing_page_accessed = 1
3. count of invitation_id where user_signed = 1
4. count of invitation_id where course_completed = 1.
I am not getting how to use different date fields, (date_created, date_signed, date_completed).
if i use single date field the counts are coming properly.
If i use canonical date as date field for weekgroup the values are changing.
Help to create a bar chart of all four measures with exact counts.
Thanks,
Pramod
- Mark as New
- Bookmark
- Subscribe
- Mute
- Subscribe to RSS Feed
- Permalink
- Report Inappropriate Content
I am also adding the image where i am getting the wrong values from the server.
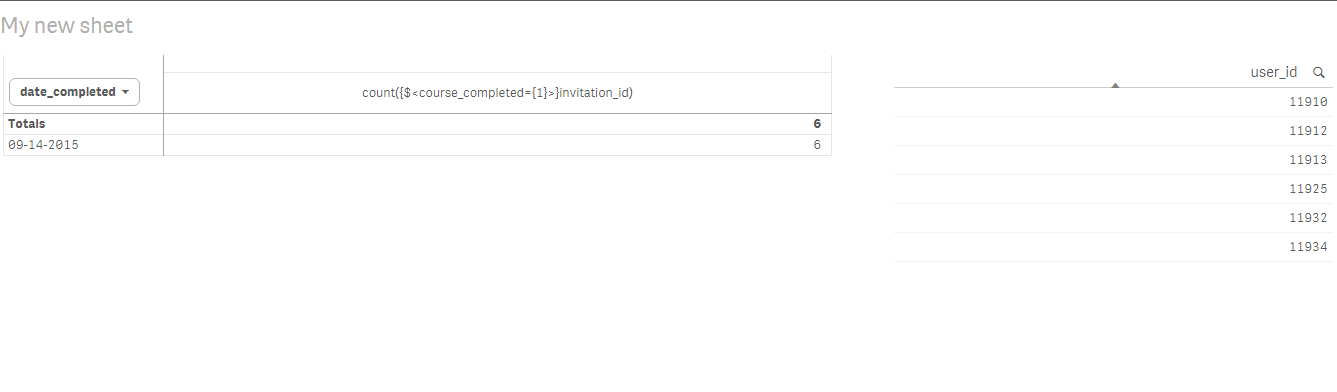
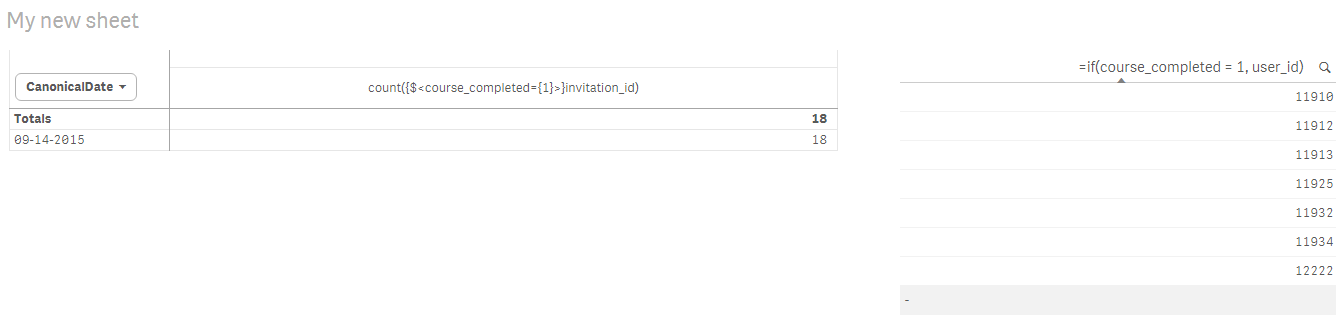
In the above images you can observe the first image is used "date_completed" date field the 6 count for date 09-14-2015 it's correct.
but, In the second image i am using the "canonical date" date field but new counts are adding.
Can you please anyone explain the reason why this is happening and where i need to correct it.
Thanks,
Pramod
- Mark as New
- Bookmark
- Subscribe
- Mute
- Subscribe to RSS Feed
- Permalink
- Report Inappropriate Content
Hi Pramod,
can you share some sample data, for better analysis.
Thanks,
Sreeni
- Mark as New
- Bookmark
- Subscribe
- Mute
- Subscribe to RSS Feed
- Permalink
- Report Inappropriate Content
Please find the sample data.