Unlock a world of possibilities! Login now and discover the exclusive benefits awaiting you.
- Qlik Community
- :
- Forums
- :
- Analytics
- :
- New to Qlik Analytics
- :
- displaying data in array in line chart
- Subscribe to RSS Feed
- Mark Topic as New
- Mark Topic as Read
- Float this Topic for Current User
- Bookmark
- Subscribe
- Mute
- Printer Friendly Page
- Mark as New
- Bookmark
- Subscribe
- Mute
- Subscribe to RSS Feed
- Permalink
- Report Inappropriate Content
displaying data in array in line chart
Hi All,
I have a mock presentation of data as below
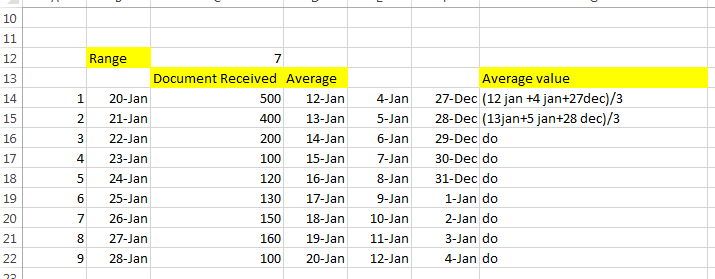
Let say I am selecting the date range as 7..so in the x axis I will have all the till 28th jan (7 days range)
now against each date I want to plot the Average value of its previous 3 sets of previous 7th day data average.(like the image above)
in a line chart.
i.e for 20 Jan..the corresponding average value will be (12 jan+4 jan+27 dec)/3
21 jan...............................................................(13 jan+5 jan+28 dec)/3)
can any one please help me with the expression.
I am trying something as below for 2 days i.e 20 and 21 jan(doing the cumulative by date here) where v date is 20th jan
(((RangeSum(Above(Sum(Aggr(Count({$<DATE={'$(=(Date(Date#('$(vDATE)','M/DD/YYYY')-8)))'}>}Documents_Produced),DATE)),0,RowNo())))
+(RangeSum(Above(Sum(Aggr(Count({$<DATE={'$(=(Date(Date#('$(vDATE)','M/DD/YYYY')-16)))'}>}Documents_Produced),DATE)),0,RowNo())))
+(RangeSum(Above(Sum(Aggr(Count({$<DATE={'$(=(Date(Date#('$(vDATE)','M/DD/YYYY')-24)))'}>}Documents_Produced),DATE)),0,RowNo()))))/3
+((RangeSum(Above(Sum(Aggr(Count({$<DATE={'$(=(Date(Date#('$(vDATE)','M/DD/YYYY')-9)))'}>}Documents_Produced),DATE)),0,RowNo())))
+(RangeSum(Above(Sum(Aggr(Count({$<DATE={'$(=(Date(Date#('$(vDATE)','M/DD/YYYY')-17)))'}>}Documents_Produced),DATE)),0,RowNo())))
+(RangeSum(Above(Sum(Aggr(Count({$<DATE={'$(=(Date(Date#('$(vDATE)','M/DD/YYYY')-25)))'}>}Documents_Produced),DATE)),0,RowNo()))))/3)
now the problem I am facing is the measure is being summed up for both the dates (since I am summing up which is ovbious) instead of storing the values in 2 different set something like in a array i.e array(average for 21 jan,average for 20 jan) and then plotting them against the time dimension in x axis.
cheers!
AD