Unlock a world of possibilities! Login now and discover the exclusive benefits awaiting you.
- Qlik Community
- :
- Forums
- :
- Analytics
- :
- New to Qlik Analytics
- :
- Re: help stacked bar chart
- Subscribe to RSS Feed
- Mark Topic as New
- Mark Topic as Read
- Float this Topic for Current User
- Bookmark
- Subscribe
- Mute
- Printer Friendly Page
- Mark as New
- Bookmark
- Subscribe
- Mute
- Subscribe to RSS Feed
- Permalink
- Report Inappropriate Content
help stacked bar chart
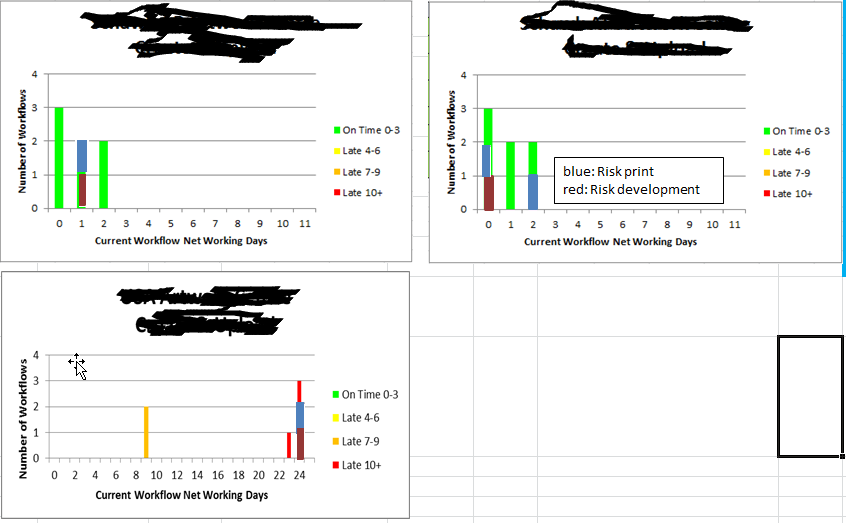
I am trying to achieve as below in a stacked bar chart. I have three dimensions..I need three different colors
no.of working days, -> (0-3 days green, 4-6 yellow, 7-9 mustard, 10+ red)
dev risk -> higlighted in brown
print risk-> highlighted in blue
- Mark as New
- Bookmark
- Subscribe
- Mute
- Subscribe to RSS Feed
- Permalink
- Report Inappropriate Content
I think you need to change how your data is visualized. Rather than Net Working Days on the x-axis, I think you should have either Risk Print / Risk Development, or the four categories of day ranges. Then you can color the data accordingly.
When editing the chart go to Appearance => Colors and Legend. Then, turn custom colors on and select "By Expression." The expression should then just be a simple IF statement.
- Mark as New
- Bookmark
- Subscribe
- Mute
- Subscribe to RSS Feed
- Permalink
- Report Inappropriate Content
Is this in QlikSense or QlikView, Could you share some sample data
- Mark as New
- Bookmark
- Subscribe
- Mute
- Subscribe to RSS Feed
- Permalink
- Report Inappropriate Content
As Tim said we can create Master item Measures and define the colors there and use them in your charts
- Mark as New
- Bookmark
- Subscribe
- Mute
- Subscribe to RSS Feed
- Permalink
- Report Inappropriate Content
If you need specific colors in the stacked bar chart I would recommend using the extension BarsPlus.
Otherwise you are stuck with the default colors or you have do a lot of playing with the code.
- Mark as New
- Bookmark
- Subscribe
- Mute
- Subscribe to RSS Feed
- Permalink
- Report Inappropriate Content
I used Barplus, but I am unable to give user defined colors.
- Mark as New
- Bookmark
- Subscribe
- Mute
- Subscribe to RSS Feed
- Permalink
- Report Inappropriate Content
How to achieve this
- Mark as New
- Bookmark
- Subscribe
- Mute
- Subscribe to RSS Feed
- Permalink
- Report Inappropriate Content
the four categories is nothing but the net days and the coloring is based on no.of completion days
eg: if its completed in 0-3 networking days- then green
4-6 yellow
7-9 mustard
10+ is red
on top of this the requirement is to indicate devrisk, print risk which are two different dimensions.
also, in qliksense, when I use color by expression, I am unable to show legend
- Mark as New
- Bookmark
- Subscribe
- Mute
- Subscribe to RSS Feed
- Permalink
- Report Inappropriate Content
qliksense
- Mark as New
- Bookmark
- Subscribe
- Mute
- Subscribe to RSS Feed
- Permalink
- Report Inappropriate Content
Here is how I think you should show this data. It may require that you rework how your data is loaded in.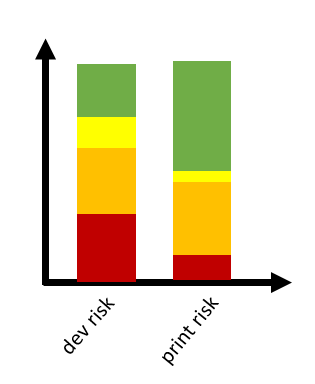
This means that Dev Risk / Print Risk need to be in the same dimension. The buckets for number of completion days will have to be in a second dimension. Yes, you will not be able to show a legend. What I do is create an image which shows what the different colors mean and put it next to the chart on the sheet.