Unlock a world of possibilities! Login now and discover the exclusive benefits awaiting you.
- Qlik Community
- :
- Forums
- :
- Analytics
- :
- New to Qlik Analytics
- :
- how to create a pie chart with the following data?
- Subscribe to RSS Feed
- Mark Topic as New
- Mark Topic as Read
- Float this Topic for Current User
- Bookmark
- Subscribe
- Mute
- Printer Friendly Page
- Mark as New
- Bookmark
- Subscribe
- Mute
- Subscribe to RSS Feed
- Permalink
- Report Inappropriate Content
how to create a pie chart with the following data?
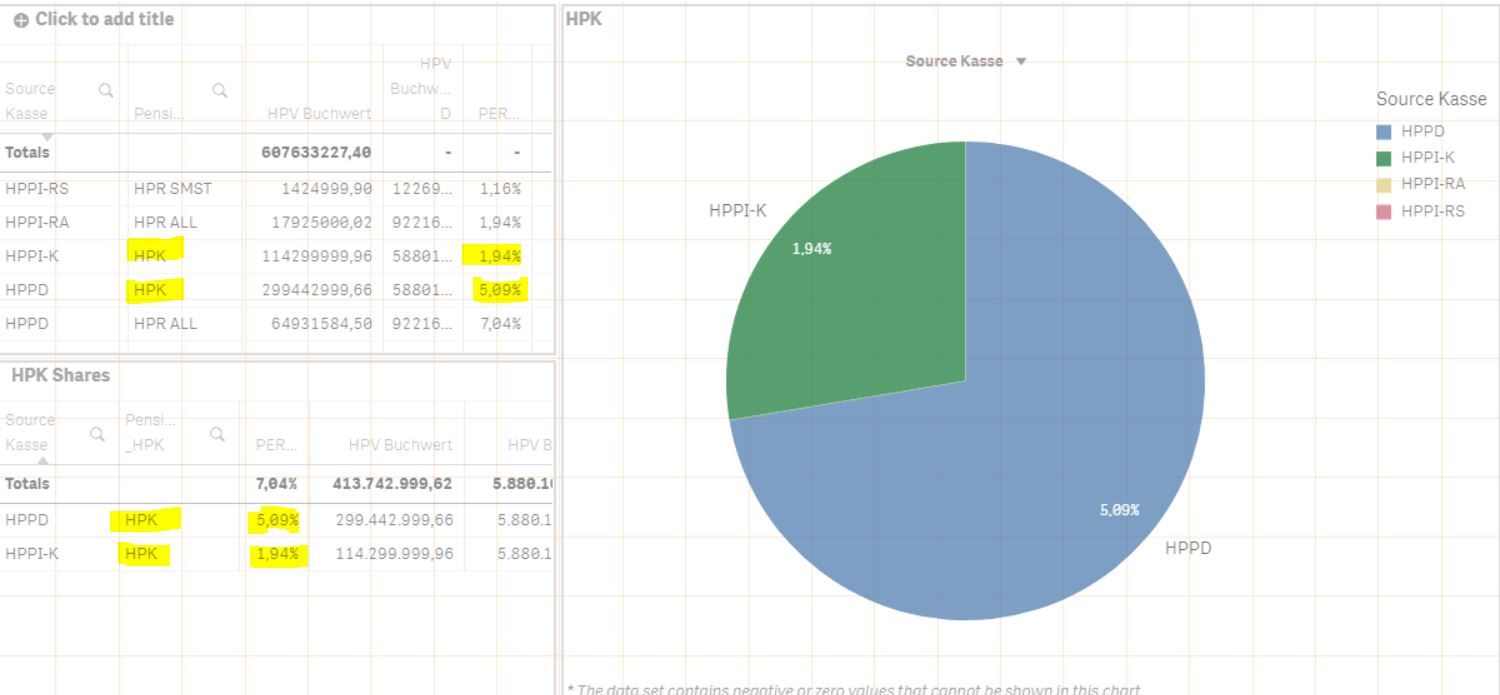
I want to share Percentage for the value of HPK for source HPPD and HPPI-K using the below columns in the pie chart.Also I dont want to use selection on Pensionseinrichtung every time i create a chart as i have to create the chart for other values as well..Hence i created the column Sum({$<Pensionseinrichtung = {'HPK'}>} [HPV Buchwert])/[HPV Buchwert D]. When I am trying to generate, the pie chart is not getting generated showing invalid values

- Mark as New
- Bookmark
- Subscribe
- Mute
- Subscribe to RSS Feed
- Permalink
- Report Inappropriate Content
One reason to why you get invalid values is the handling of [HPV Buchwert D]. By selection 'HPK' in the datamodel you reduce the values available for [HPV Buchwert D], but in your expression you dont.
If you are expection only one value for [HPV Buchwert D] you cound try the following expression:
Sum({$<Pensionseinrichtung = {'HPK'}>} [HPV Buchwert])
/
only({$<Pensionseinrichtung = {'HPK'}>}[HPV Buchwert D])
Qlik Community MVP
- Mark as New
- Bookmark
- Subscribe
- Mute
- Subscribe to RSS Feed
- Permalink
- Report Inappropriate Content
I modified the chart with your help. But the problem I am facing is that i cant show the other shares in pie chart which does not contain the share of HPK in my pie.But that is visible in my table chart.The code i used for pie chart generation is:
Sum({$<Pensionseinrichtung = {'HPK'}>} [HPV Buchwert])
/
only(Sum(Total{$<Pensionseinrichtung = {'HPK'},Stichtag_HPV = {'31.12.2018'}>}[HPV Buchwert])).I plotted this vs Source Kasse. I also want to show the remaining percentage as others for eg (100-(1.94+5.09)=92%) in my pie chart
