Unlock a world of possibilities! Login now and discover the exclusive benefits awaiting you.
- Qlik Community
- :
- Forums
- :
- Analytics
- :
- New to Qlik Analytics
- :
- Re: how to create 'inner join' for the 2 data set
- Subscribe to RSS Feed
- Mark Topic as New
- Mark Topic as Read
- Float this Topic for Current User
- Bookmark
- Subscribe
- Mute
- Printer Friendly Page
- Mark as New
- Bookmark
- Subscribe
- Mute
- Subscribe to RSS Feed
- Permalink
- Report Inappropriate Content
how to create 'inner join' for the 2 data set
Hi
Wondering, how could i do the inner join for 2 dataset?
after I join the data from 'data Manager' and then load. I went to 'data load editor'.
did not find any where i can put
'inner join' or see the data sets 'joined'
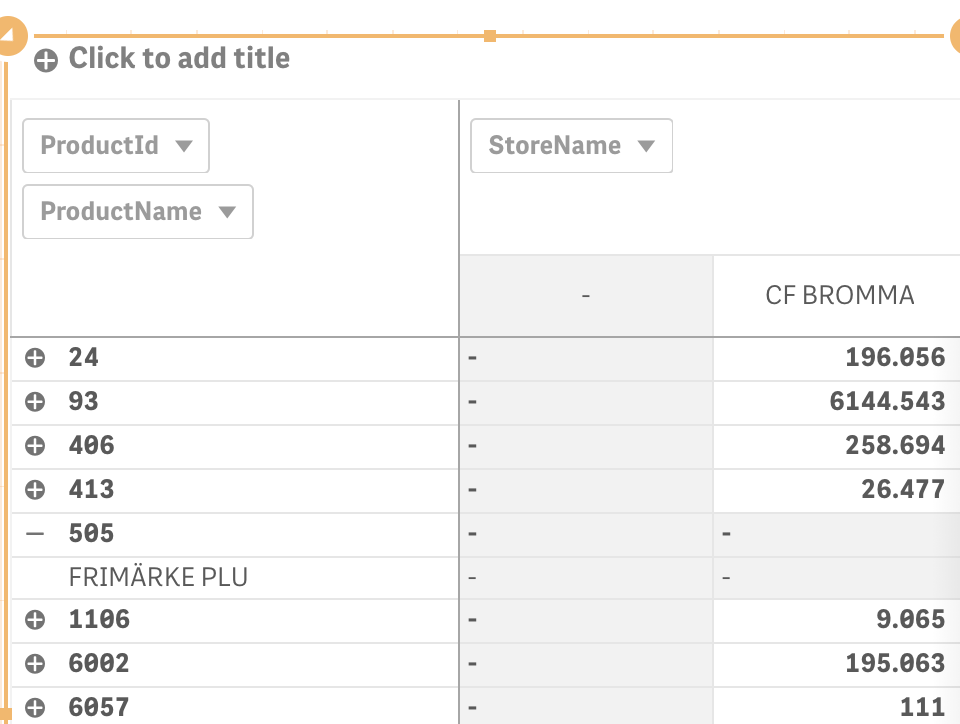
problem is. there are some empty line in the data set
when i do pivot table , then the 'Empty' row become one separate line.
I have same issue if I use the bar chart.
How could I solve this issue?
Thank you!
- Tags:
- inner join
- pivotable
- « Previous Replies
-
- 1
- 2
- Next Replies »
Accepted Solutions
- Mark as New
- Bookmark
- Subscribe
- Mute
- Subscribe to RSS Feed
- Permalink
- Report Inappropriate Content
I am not really sure what might be happening, what I gave you was the syntax for Inner Join and Inner Keep. May be someone else can offer better help here 
- Mark as New
- Bookmark
- Subscribe
- Mute
- Subscribe to RSS Feed
- Permalink
- Report Inappropriate Content
What is your script look like? Can you share the script?
- Mark as New
- Bookmark
- Subscribe
- Mute
- Subscribe to RSS Feed
- Permalink
- Report Inappropriate Content
Sure:
Set dataManagerTables = '','Stockholm3store7dayPlu','Pluhierarchy','StoreLocation';
//This block renames script tables from non generated section which conflict with the names of managed tables
For each name in $(dataManagerTables)
Let index = 0;
Let currentName = name;
Let tableNumber = TableNumber(name);
Let matches = 0;
Do while not IsNull(tableNumber) or (index > 0 and matches > 0)
index = index + 1;
currentName = name & '-' & index;
tableNumber = TableNumber(currentName)
matches = Match('$(currentName)', $(dataManagerTables));
Loop
If index > 0 then
Rename Table '$(name)' to '$(currentName)';
EndIf;
Next;
[Stockholm3store7dayPlu]:
LOAD [ButiN],
[KvitD],
[PluId],
[Sales],
[Cost],
[n_items]
FROM [lib://AttachedFiles/Stockholm3store7dayPlu.csv]
(txt, codepage is 28591, embedded labels, delimiter is ',', msq);
[Pluhierarchy]:
LOAD [PluId],
[ProductName],
[CategoryId],
[CategoryName],
[SUBKATEGORI],
[SUBKATEGORINAMN],
[SEGMENT],
[SEGMENTNAMN],
[SUBSEGMENT],
[SUBSEGMENTNAMN],
[LEVNR],
[LEVNAMN],
[VARUMARKE],
[INNEHALL],
[SORTENHET],
[MILJOKODNAMN],
[ARTIKEL_EJ_I_MASTERDATA]
FROM [lib://AttachedFiles/SKU and StoreInfo.xlsx]
(ooxml, embedded labels, table is Pluhierarchy);
[StoreLocation]:
LOAD [ButiN],
[ButikName],
[Adress],
[Postcode],
[lng],
[lat],
GeoMakePoint(lat, lng) as 'Location'
FROM [lib://AttachedFiles/SKU and StoreInfo.xlsx]
(ooxml, embedded labels, table is StoreLocation);
[autoCalendar]:
DECLARE FIELD DEFINITION Tagged ('$date')
FIELDS
Dual(Year($1), YearStart($1)) AS [Year] Tagged ('$axis', '$year'),
Dual('Q'&Num(Ceil(Num(Month($1))/3)),Num(Ceil(NUM(Month($1))/3),00)) AS [Quarter] Tagged ('$quarter', '$cyclic'),
Dual(Year($1)&'-Q'&Num(Ceil(Num(Month($1))/3)),QuarterStart($1)) AS [YearQuarter] Tagged ('$yearquarter', '$qualified'),
Dual('Q'&Num(Ceil(Num(Month($1))/3)),QuarterStart($1)) AS [_YearQuarter] Tagged ('$yearquarter', '$hidden', '$simplified'),
Month($1) AS [Month] Tagged ('$month', '$cyclic'),
Dual(Year($1)&'-'&Month($1), monthstart($1)) AS [YearMonth] Tagged ('$axis', '$yearmonth', '$qualified'),
Dual(Month($1), monthstart($1)) AS [_YearMonth] Tagged ('$axis', '$yearmonth', '$simplified', '$hidden'),
Dual('W'&Num(Week($1),00), Num(Week($1),00)) AS [Week] Tagged ('$weeknumber', '$cyclic'),
Date(Floor($1)) AS [Date] Tagged ('$axis', '$date', '$qualified'),
Date(Floor($1), 'D') AS [_Date] Tagged ('$axis', '$date', '$hidden', '$simplified'),
If (DayNumberOfYear($1) <= DayNumberOfYear(Today()), 1, 0) AS [InYTD] ,
Year(Today())-Year($1) AS [YearsAgo] ,
If (DayNumberOfQuarter($1) <= DayNumberOfQuarter(Today()),1,0) AS [InQTD] ,
4*Year(Today())+Ceil(Month(Today())/3)-4*Year($1)-Ceil(Month($1)/3) AS [QuartersAgo] ,
Ceil(Month(Today())/3)-Ceil(Month($1)/3) AS [QuarterRelNo] ,
If(Day($1)<=Day(Today()),1,0) AS [InMTD] ,
12*Year(Today())+Month(Today())-12*Year($1)-Month($1) AS [MonthsAgo] ,
Month(Today())-Month($1) AS [MonthRelNo] ,
If(WeekDay($1)<=WeekDay(Today()),1,0) AS [InWTD] ,
(WeekStart(Today())-WeekStart($1))/7 AS [WeeksAgo] ,
Week(Today())-Week($1) AS [WeekRelNo] ;
DERIVE FIELDS FROM FIELDS [KvitD] USING [autoCalendar] ;
- Mark as New
- Bookmark
- Subscribe
- Mute
- Subscribe to RSS Feed
- Permalink
- Report Inappropriate Content
And also see your comment regarding chose the top 10 product for bar chart but is that the same trick for Qliq sense?
Same dataset,
want to show top 10 'ProductName', Ranking by 'sum([n_items])'
Thank you. let me know if you prefer will ask the it separately
- Mark as New
- Bookmark
- Subscribe
- Mute
- Subscribe to RSS Feed
- Permalink
- Report Inappropriate Content
May be this
For each name in $(dataManagerTables)
Let index = 0;
Let currentName = name;
Let tableNumber = TableNumber(name);
Let matches = 0;
Do while not IsNull(tableNumber) or (index > 0 and matches > 0)
index = index + 1;
currentName = name & '-' & index;
tableNumber = TableNumber(currentName)
matches = Match('$(currentName)', $(dataManagerTables));
Loop
If index > 0 then
Rename Table '$(name)' to '$(currentName)';
EndIf;
Next;
[Stockholm3store7dayPlu]:
LOAD [ButiN],
[KvitD],
[PluId],
[Sales],
[Cost],
[n_items]
FROM [lib://AttachedFiles/Stockholm3store7dayPlu.csv]
(txt, codepage is 28591, embedded labels, delimiter is ',', msq);
Inner Join ([Stockholm3store7dayPlu])
LOAD [PluId],
[ProductName],
[CategoryId],
[CategoryName],
[SUBKATEGORI],
[SUBKATEGORINAMN],
[SEGMENT],
[SEGMENTNAMN],
[SUBSEGMENT],
[SUBSEGMENTNAMN],
[LEVNR],
[LEVNAMN],
[VARUMARKE],
[INNEHALL],
[SORTENHET],
[MILJOKODNAMN],
[ARTIKEL_EJ_I_MASTERDATA]
FROM [lib://AttachedFiles/SKU and StoreInfo.xlsx]
(ooxml, embedded labels, table is Pluhierarchy);
Inner Join ([Stockholm3store7dayPlu])
LOAD [ButiN],
[ButikName],
[Adress],
[Postcode],
[lng],
[lat],
GeoMakePoint(lat, lng) as 'Location'
FROM [lib://AttachedFiles/SKU and StoreInfo.xlsx]
(ooxml, embedded labels, table is StoreLocation);
[autoCalendar]:
DECLARE FIELD DEFINITION Tagged ('$date')
FIELDS
Dual(Year($1), YearStart($1)) AS [Year] Tagged ('$axis', '$year'),
Dual('Q'&Num(Ceil(Num(Month($1))/3)),Num(Ceil(NUM(Month($1))/3),00)) AS [Quarter] Tagged ('$quarter', '$cyclic'),
Dual(Year($1)&'-Q'&Num(Ceil(Num(Month($1))/3)),QuarterStart($1)) AS [YearQuarter] Tagged ('$yearquarter', '$qualified'),
Dual('Q'&Num(Ceil(Num(Month($1))/3)),QuarterStart($1)) AS [_YearQuarter] Tagged ('$yearquarter', '$hidden', '$simplified'),
Month($1) AS [Month] Tagged ('$month', '$cyclic'),
Dual(Year($1)&'-'&Month($1), monthstart($1)) AS [YearMonth] Tagged ('$axis', '$yearmonth', '$qualified'),
Dual(Month($1), monthstart($1)) AS [_YearMonth] Tagged ('$axis', '$yearmonth', '$simplified', '$hidden'),
Dual('W'&Num(Week($1),00), Num(Week($1),00)) AS [Week] Tagged ('$weeknumber', '$cyclic'),
Date(Floor($1)) AS [Date] Tagged ('$axis', '$date', '$qualified'),
Date(Floor($1), 'D') AS [_Date] Tagged ('$axis', '$date', '$hidden', '$simplified'),
If (DayNumberOfYear($1) <= DayNumberOfYear(Today()), 1, 0) AS [InYTD] ,
Year(Today())-Year($1) AS [YearsAgo] ,
If (DayNumberOfQuarter($1) <= DayNumberOfQuarter(Today()),1,0) AS [InQTD] ,
4*Year(Today())+Ceil(Month(Today())/3)-4*Year($1)-Ceil(Month($1)/3) AS [QuartersAgo] ,
Ceil(Month(Today())/3)-Ceil(Month($1)/3) AS [QuarterRelNo] ,
If(Day($1)<=Day(Today()),1,0) AS [InMTD] ,
12*Year(Today())+Month(Today())-12*Year($1)-Month($1) AS [MonthsAgo] ,
Month(Today())-Month($1) AS [MonthRelNo] ,
If(WeekDay($1)<=WeekDay(Today()),1,0) AS [InWTD] ,
(WeekStart(Today())-WeekStart($1))/7 AS [WeeksAgo] ,
Week(Today())-Week($1) AS [WeekRelNo] ;
DERIVE FIELDS FROM FIELDS [KvitD] USING [autoCalendar] ;
- Mark as New
- Bookmark
- Subscribe
- Mute
- Subscribe to RSS Feed
- Permalink
- Report Inappropriate Content
Not sure I understand?
- Mark as New
- Bookmark
- Subscribe
- Mute
- Subscribe to RSS Feed
- Permalink
- Report Inappropriate Content
Thank you Sunny,
but seems it does not work
 ou
ou
any suggestion?
I add the line you add to the place
- Mark as New
- Bookmark
- Subscribe
- Mute
- Subscribe to RSS Feed
- Permalink
- Report Inappropriate Content
Sorry for confusing.
I am trying to create a bar chart and it has more than 2000 product. But I want to only filted top 10 to show.
was searching answer in the community, came across one answer you provide to the other having similar issue. but using Qlik view.
So i mentioned it.
- Mark as New
- Bookmark
- Subscribe
- Mute
- Subscribe to RSS Feed
- Permalink
- Report Inappropriate Content
Try with inner keep may be
[Pluhierarchy]:
Inner Keep ([Stockholm3store7dayPlu])
LOAD [PluId],
[ProductName],
[CategoryId],
[CategoryName],
[SUBKATEGORI],
[SUBKATEGORINAMN],
[SEGMENT],
[SEGMENTNAMN],
[SUBSEGMENT],
[SUBSEGMENTNAMN],
[LEVNR],
[LEVNAMN],
[VARUMARKE],
[INNEHALL],
[SORTENHET],
[MILJOKODNAMN],
[ARTIKEL_EJ_I_MASTERDATA]
FROM [lib://AttachedFiles/SKU and StoreInfo.xlsx]
(ooxml, embedded labels, table is Pluhierarchy);
[StoreLocation]:
Inner Keep ([Stockholm3store7dayPlu])
LOAD [ButiN],
[ButikName],
[Adress],
[Postcode],
[lng],
[lat],
GeoMakePoint(lat, lng) as 'Location'
FROM [lib://AttachedFiles/SKU and StoreInfo.xlsx]
(ooxml, embedded labels, table is StoreLocation);
- Mark as New
- Bookmark
- Subscribe
- Mute
- Subscribe to RSS Feed
- Permalink
- Report Inappropriate Content
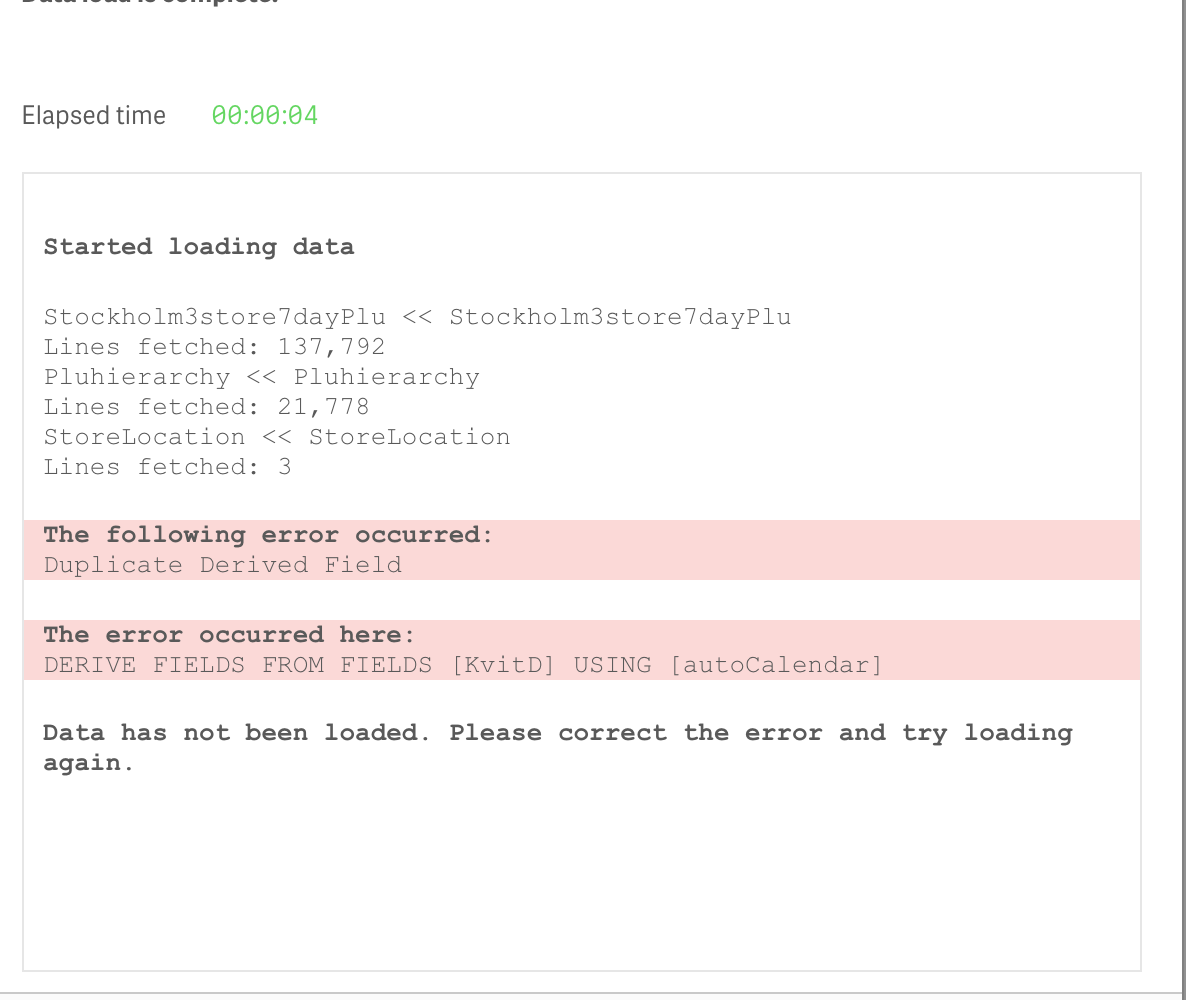
Sorry. I tried both. but does not work.
- « Previous Replies
-
- 1
- 2
- Next Replies »