Unlock a world of possibilities! Login now and discover the exclusive benefits awaiting you.
- Qlik Community
- :
- Forums
- :
- Analytics
- :
- New to Qlik Analytics
- :
- how to swap chart with radio button?
- Subscribe to RSS Feed
- Mark Topic as New
- Mark Topic as Read
- Float this Topic for Current User
- Bookmark
- Subscribe
- Mute
- Printer Friendly Page
- Mark as New
- Bookmark
- Subscribe
- Mute
- Subscribe to RSS Feed
- Permalink
- Report Inappropriate Content
how to swap chart with radio button?
Hi everyone,
i was asking myself if it's possible to change chart with a radio button ( like a parameter in tableau), but without any extension or mashups.
thank you so much in advance
- Mark as New
- Bookmark
- Subscribe
- Mute
- Subscribe to RSS Feed
- Permalink
- Report Inappropriate Content
Hi
Yes it is possible using container object , and button for navigation object
Create using variable panel editor 2 variables
vShow with 0 as value
vHide with 1 as value
Then creates your 2 charts and add them in a container object
creates 2 buttons :
for bar chart add action using "define variable value" in the list select
vShow and 0 as value
repeat the same calling vHide and 1 as value
For Line Chart button do the same and for
vShow 1 as value
vHide 0 as value
next in your container object
on first chart add =$(vShow) in the show condition option
on second chart add =$(vHide) in the show condition option
you may have something like this :
by clicking on bar chart :
by cliking on Line chart :
Regards
- Mark as New
- Bookmark
- Subscribe
- Mute
- Subscribe to RSS Feed
- Permalink
- Report Inappropriate Content
Hello Bruno,
thanks for your prompt answer.
I've repeated all your step above but actually it seems that, even though one of the tables disappears, the button provided for the othet table
doesn't work.
Below steps made for these actions:
- Created Variable vShow = 0;
- Created Variable vHide = 1;
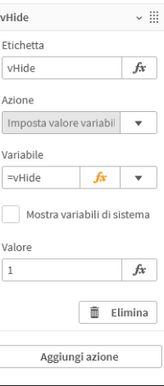
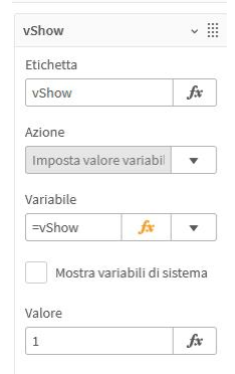
- Created Summary/Details Buttons;
- For Summary created 2 actions, vShow and vHide, with values 0 and 1;
- For Details created 2 actions, vShow and vHide, with values 1 and 0;
- Added the two tables in a container;
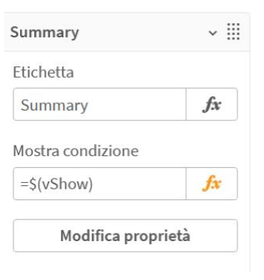
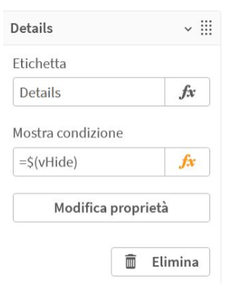
- For Summary table added show condition =$(vShow), for Details table added show condition =$(vHide).
When i click finish edit on qlik, Summary Tables disappears, but when i try to click on Summary Button, nothing changes.
Am i making some Mistakes?
Thanks
- Mark as New
- Bookmark
- Subscribe
- Mute
- Subscribe to RSS Feed
- Permalink
- Report Inappropriate Content
Hi
Can you try to reverse variable :
For Summary =$(vHide) under "Mostra condizione"
For Details=$(vShow) under mostra condizione"
regards
- Mark as New
- Bookmark
- Subscribe
- Mute
- Subscribe to RSS Feed
- Permalink
- Report Inappropriate Content
Thank you for your prompt respond...
But now i 've just reversed the problem.
Now summary is the table that appears, but when i click details button nothing changes.
i can't figure out what im doing wrong.
- Mark as New
- Bookmark
- Subscribe
- Mute
- Subscribe to RSS Feed
- Permalink
- Report Inappropriate Content
Hi
Strange , it works for me , can your share your app or a qvd with sample data so that i could test it ?
regards
Bruno
- Mark as New
- Bookmark
- Subscribe
- Mute
- Subscribe to RSS Feed
- Permalink
- Report Inappropriate Content
i've managed using
='vShow'
thank you so much


