Unlock a world of possibilities! Login now and discover the exclusive benefits awaiting you.
- Qlik Community
- :
- Forums
- :
- Analytics
- :
- New to Qlik Analytics
- :
- line graph for every Two months
- Subscribe to RSS Feed
- Mark Topic as New
- Mark Topic as Read
- Float this Topic for Current User
- Bookmark
- Subscribe
- Mute
- Printer Friendly Page
- Mark as New
- Bookmark
- Subscribe
- Mute
- Subscribe to RSS Feed
- Permalink
- Report Inappropriate Content
line graph for every Two months
Hi all,
I need to display line graph as below.
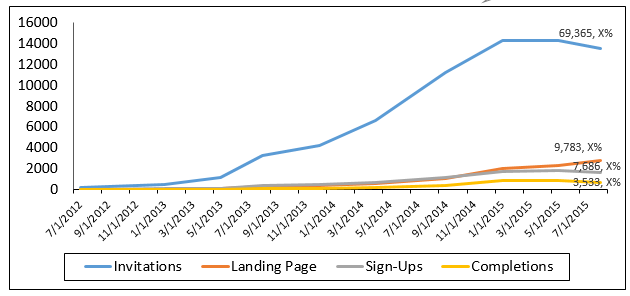
From the start date in the table to today's date i need to display data for two months once.
I am using canonical date as dimension what need to change.
Measures:
Count({$<DateType = {invitation}>}invitation_id)
Count({$<DateType={accessed}>}invitation_id)
count({$<user_signed={1},DateType={signed}>}user_signed)
Regards,
Pramod
- Tags:
- linechart
- « Previous Replies
-
- 1
- 2
- Next Replies »
- Mark as New
- Bookmark
- Subscribe
- Mute
- Subscribe to RSS Feed
- Permalink
- Report Inappropriate Content
Try this:
if(mod(Date(monthStart(CanonicalDate), 'DD/MM/YYYY'),2)=0,Date(monthStart(CanonicalDate), 'MMM/YYYY'),NULL())
If I'm not wrong you need to look into your data set as some dates are in Month/Day format other Day/Month
Feeling Qlikngry?
- Mark as New
- Bookmark
- Subscribe
- Mute
- Subscribe to RSS Feed
- Permalink
- Report Inappropriate Content
Thanks,
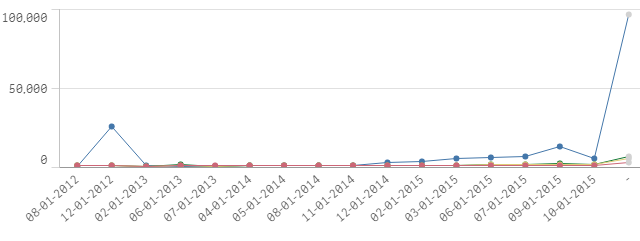
It looks good, slight changes needed i think.
You can observe in the image that the months difference is not exactly 2 months.
what may be the reason? how can i improve?
- Mark as New
- Bookmark
- Subscribe
- Mute
- Subscribe to RSS Feed
- Permalink
- Report Inappropriate Content
That's because you test dates on even / odd value, not month:
if(Even(Month(CanonicalDate)),Date(monthStart(CanonicalDate), 'MMM/YYYY'),NULL())
But I would rather create a flag in your calendar table for that and then filter via set expression.
- Mark as New
- Bookmark
- Subscribe
- Mute
- Subscribe to RSS Feed
- Permalink
- Report Inappropriate Content
If i need show 4 months graph then what expression should i use?
No need of odd or even, it should be according to the starting month available, it may be odd or even.
- Mark as New
- Bookmark
- Subscribe
- Mute
- Subscribe to RSS Feed
- Permalink
- Report Inappropriate Content
If you are using my expression change 2 to 4
Remember you can mark questions answered or helpful.
Feeling Qlikngry?
- Mark as New
- Bookmark
- Subscribe
- Mute
- Subscribe to RSS Feed
- Permalink
- Report Inappropriate Content
Hi Robert,
can you check my last reply with image that i am using your expression. But the difference of two months is not getting properly.
Please help on it improve....
- Mark as New
- Bookmark
- Subscribe
- Mute
- Subscribe to RSS Feed
- Permalink
- Report Inappropriate Content
Hi Robert,
The count is getting wrong for the above expression.
The count is getting only for that month, not for the two months.
For ex: 09/01/2015 the count of 09-01-2015 to 09-30-2015 is displaying
- Mark as New
- Bookmark
- Subscribe
- Mute
- Subscribe to RSS Feed
- Permalink
- Report Inappropriate Content
I think you would need to create a consecutive MonthCounter field in your data model, then you can write your expression like
if( Mod( MonthCounter - Top(MonthCounter) ),4)=0, Date(monthStart(CanonicalDate), 'MMM/YYYY'),NULL())
Also the Date(monthStart(CanonicalDate) could be already calculated in the script as canonical MonthStart field.
edit: Sorry this probably won't work, because it forgot that's it a calculated condition.
But you can use CanonicalMonthStart field as dimension and as expression something like:
=Sum({<MonthCounter = {"=Mod(MonthCounter-Min(Total MonthCounter),4)=0"}>} Value)
- Mark as New
- Bookmark
- Subscribe
- Mute
- Subscribe to RSS Feed
- Permalink
- Report Inappropriate Content
how can i create a consecutive MonthCounter field in data model?
- Mark as New
- Bookmark
- Subscribe
- Mute
- Subscribe to RSS Feed
- Permalink
- Report Inappropriate Content
For example like
Year(Date) * 12 + Month(Date) as MonthCounter
- « Previous Replies
-
- 1
- 2
- Next Replies »