Unlock a world of possibilities! Login now and discover the exclusive benefits awaiting you.
- Qlik Community
- :
- Forums
- :
- Analytics
- :
- New to Qlik Analytics
- :
- pivot table dynamic dimension with dynamic top N
- Subscribe to RSS Feed
- Mark Topic as New
- Mark Topic as Read
- Float this Topic for Current User
- Bookmark
- Subscribe
- Mute
- Printer Friendly Page
- Mark as New
- Bookmark
- Subscribe
- Mute
- Subscribe to RSS Feed
- Permalink
- Report Inappropriate Content
pivot table dynamic dimension with dynamic top N
I would like to create a dynamic dimension with dynamic top N
This means that user can use a slider to select from 1 to 100 for top N and a drop down list for dimension.
Therefore , user can filter for example , top 3 Sales for Country or Top 5 Sales for Category based on sales in 2021 based on the sample dataset below.
This means user can have flexibility on choosing which dimension and how many top N for selected dimension based on sales in 2021
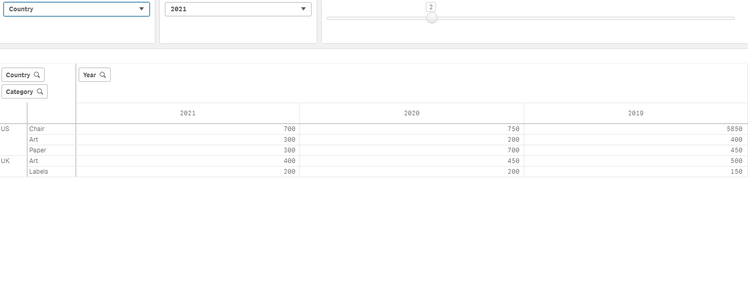
For example, I select country as variable input for dimension and top 2 then result should be as below:
For example, if I select Category as variable input for dimension and top 2 then result should be as below:
- Tags:
- pivot tables
- Mark as New
- Bookmark
- Subscribe
- Mute
- Subscribe to RSS Feed
- Permalink
- Report Inappropriate Content
Hi
Specify vDim, add a variable input with relevant dimensions and use $(vDim) as dimension (and ='$(vDim)' as label)
Add your measure.
Specify vTopN and use this to limit you measure.
This gets you a basic toplist
But you want a pivot table and sorted by 2021. This will make it a little bit more tricky as Qlik. Add Year as a column and sort by first expression and you might get something like this if the most sold items are different between years. Also Qlik will be a bit messy when sorting the years.
As I understand it from your question you want the top list to be based on 2021, not like above.
Add a new variable VRankYear and either set it to max(year) or create a variable input drop down with all years (=concat(distinct(Year),'|')) if you want to be able to look at different years.
Change measure to something like
sum( {<$(vDim) = {"=Rank( sum( {$<Year = {$(vRankYear)}>} Sales))<$(vTopN)+1"}>} Sales)
This will show sales for Items that ranks in your Top 3 for your selected year.
Sort ='$(vDim)' by Sum( {$<Year = {$(vRankYear)}>} Sales)
Here you can se how the toplist first shows top sales based on top sellers in 2021, if you change your rank year to 2019 Chair will no longer be on the top list, Paper will instead move up.
Hope this helps.
- Mark as New
- Bookmark
- Subscribe
- Mute
- Subscribe to RSS Feed
- Permalink
- Report Inappropriate Content
I understand your solution but I would like both country and category display together in the row of pivot table. I am seeking solution whether the variable for dimension can be used for user to determine which dimension used for top N analysis.
For example, if user select category in the drop down list. This means I would like to get the top N sales of category based on the sales amount in 2021.
if I select country in the drop down list, system filter top x of country based on the sales amount of each countries
- Mark as New
- Bookmark
- Subscribe
- Mute
- Subscribe to RSS Feed
- Permalink
- Report Inappropriate Content
Sorry, I don't understand how you expect the filter to work. If you select Category, do you want to see the global top selling N Categories or the local for every country?
Let's say N=2 and category is selected. I haven't counted, but Phones and Machines look bif so let's say they are global no 1 and 2.
Should this result in only UK/China/Norway are displayed as they are the only one with Phones/Machines?
Or should the top N be local? The same selections would then result in BookCase/Art for UK, Machines/Phones for China etc?
And if we change drop down to Country, but keep N=2
Should this filter China and Korea only, but the whole list of categories is visible?
- Mark as New
- Bookmark
- Subscribe
- Mute
- Subscribe to RSS Feed
- Permalink
- Report Inappropriate Content
I updated the original post with example.. Please kindly help. thanks
- Mark as New
- Bookmark
- Subscribe
- Mute
- Subscribe to RSS Feed
- Permalink
- Report Inappropriate Content
Great. You can use pretty much the same setup as in my previous answer, but change dimension from $(vDIM) to Country and Category. (If you want them sorted by Sales they should be sorted by Sum( {$<Year = {$(vRankYear)}>} Sales))
Category selected, N-slider = 3
Country selected, N-slider changed to 2


