Unlock a world of possibilities! Login now and discover the exclusive benefits awaiting you.
- Qlik Community
- :
- Forums
- :
- Analytics
- :
- New to Qlik Analytics
- :
- qlik sense chart box
Options
- Subscribe to RSS Feed
- Mark Topic as New
- Mark Topic as Read
- Float this Topic for Current User
- Bookmark
- Subscribe
- Mute
- Printer Friendly Page
Turn on suggestions
Auto-suggest helps you quickly narrow down your search results by suggesting possible matches as you type.
Showing results for
Contributor II
2021-09-27
01:33 AM
- Mark as New
- Bookmark
- Subscribe
- Mute
- Subscribe to RSS Feed
- Permalink
- Report Inappropriate Content
qlik sense chart box
Hello,
I am trying to create bar chart with 2 measures & 1dimension.
Dimesion is country
1st measure is count of id and 2nd measure is sum of transaction
count of Id's values are in thousands range ,and sum of transaction is in millions range ,so charts show only transactions chart and count of id bars are very tiny
how can I work on this or should I user another charts
216 Views
1 Reply
MVP
2021-09-27
03:13 AM
- Mark as New
- Bookmark
- Subscribe
- Mute
- Subscribe to RSS Feed
- Permalink
- Report Inappropriate Content
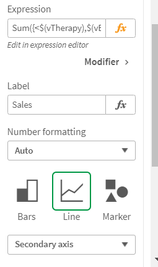
Use a combo-chart. The second measure should be chosen as secondary axis.
Then two measures would be shown on two different axes, and that should resolve your issue.
188 Views
Community Browser
