Unlock a world of possibilities! Login now and discover the exclusive benefits awaiting you.
- Qlik Community
- :
- Forums
- :
- Analytics
- :
- New to Qlik Analytics
- :
- Re: questions QlikSense development
- Subscribe to RSS Feed
- Mark Topic as New
- Mark Topic as Read
- Float this Topic for Current User
- Bookmark
- Subscribe
- Mute
- Printer Friendly Page
- Mark as New
- Bookmark
- Subscribe
- Mute
- Subscribe to RSS Feed
- Permalink
- Report Inappropriate Content
questions QlikSense development
Hello
I have been using Qliksense lately and I have raised some questions,
- Totals of a table are not exported with Excel.
- If an expression is calculated with an if() how can we show the total?
- is there a possibility to show/hide a total by individual expression?
- enlarge/narrow table columns
- I have an error that appears if there are negative values that are calculated in an expression (in a Pie chart)
- is there any way to change the dimension Colour
Thank you in advance for your answers
Regards
- Mark as New
- Bookmark
- Subscribe
- Mute
- Subscribe to RSS Feed
- Permalink
- Report Inappropriate Content
Hello Meriem,
I verified the items in your bullet-ed list.
- Totals of a table are not exported with Excel.
(VERIFIED) - question out to R&D- If an expression is calculated with an if() how can we show the total?
(VERIFIED) - question out to R&D
Work-around - Instead of calculating the measure in the chart object - calculated as part of the Load Script
- is there a possibility to show/hide a total by individual expression?
- No - there currently aren't any show / hide conditions in Qlik Sense- enlarge/narrow table columns
-The responsive design - adjust the columns automatically, but I understand why you would want this
I sent to R&D- I have an error that appears if there are negative values that are calculated in an expression (in a Pie chart)
Please reply with the error- is there any way to change the dimension Colour
Do you mean the dimension value text color in a table or the visual indicator (bars, dots, lines, slice) in a chart object?
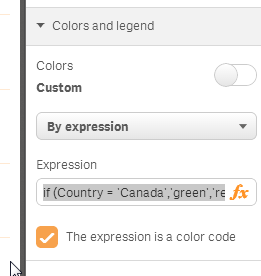
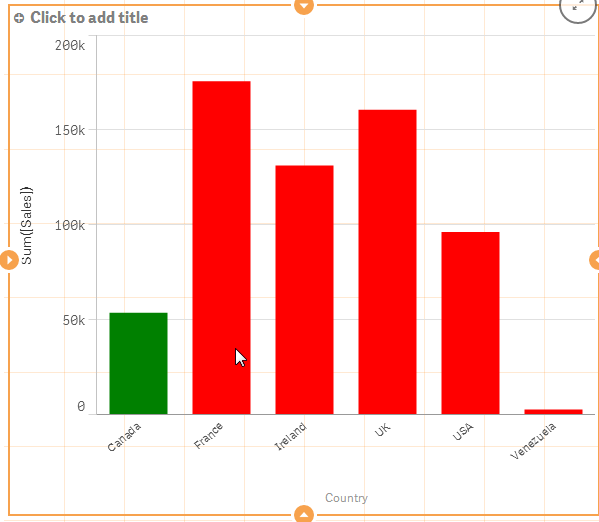
In a chart object (ie. bar chart) - you can color by expression, by measure, by dimension.
You can use a color expression such as: if (Country = 'Canada','green','red')
Let me know how you do.
Regards,
Mike
Mike Tarallo
Qlik
- Mark as New
- Bookmark
- Subscribe
- Mute
- Subscribe to RSS Feed
- Permalink
- Report Inappropriate Content
Hello
- for the Question n°5 you will find bellow the error that appears on the chart.

- As for question n°6 what i meant was the Dimension column's background or text colour.
Thank you so much for your reactivity
Regards
- Mark as New
- Bookmark
- Subscribe
- Mute
- Subscribe to RSS Feed
- Permalink
- Report Inappropriate Content
Hi Merirem,
for #5 - English:
"The data set contains negative values being equal to zero or impossible to display in this graph"
Check your expression or data values using a Table object - you can't use a Pie chart with a negative value.

for #6 - check out this help link, Example 3:

Please mark the appropriate replies as helpful / correct so our team and other members know that your question(s) has been answered to your satisfaction.
Regards,
Mike
Mike Tarallo
Qlik