Unlock a world of possibilities! Login now and discover the exclusive benefits awaiting you.
- Qlik Community
- :
- Forums
- :
- Analytics
- :
- New to Qlik Analytics
- :
- Re: sum two maximum from the start
- Subscribe to RSS Feed
- Mark Topic as New
- Mark Topic as Read
- Float this Topic for Current User
- Bookmark
- Subscribe
- Mute
- Printer Friendly Page
- Mark as New
- Bookmark
- Subscribe
- Mute
- Subscribe to RSS Feed
- Permalink
- Report Inappropriate Content
sum two maximum from the start
Hello everyone !
I have a list with sales date in this format (eliminating the time, so there are recurring dates) and the sales.
| Date | Sale | |
|---|---|---|
| 10 | |
| 11 | |
| 12 | |
| 12 | |
| 5 | |
| 9 | |
| 15 | |
| 8 | |
| 8 | |
| 3 | |
| 20 | |
| 9 |
I want to make a line graph showing me the sum of the two highest sales since the beginning of time starting from the first date. Thus becomes:
| Date | Sale | |
|---|---|---|
| 21 | |
| 24 | |
| 24 | |
| 27 | |
| 27 | |
| 27 | |
| 35 |
I have tried many "measures" to make this graphic but no results. Any suggestions?
Regards !
- « Previous Replies
-
- 1
- 2
- Next Replies »
- Mark as New
- Bookmark
- Subscribe
- Mute
- Subscribe to RSS Feed
- Permalink
- Report Inappropriate Content
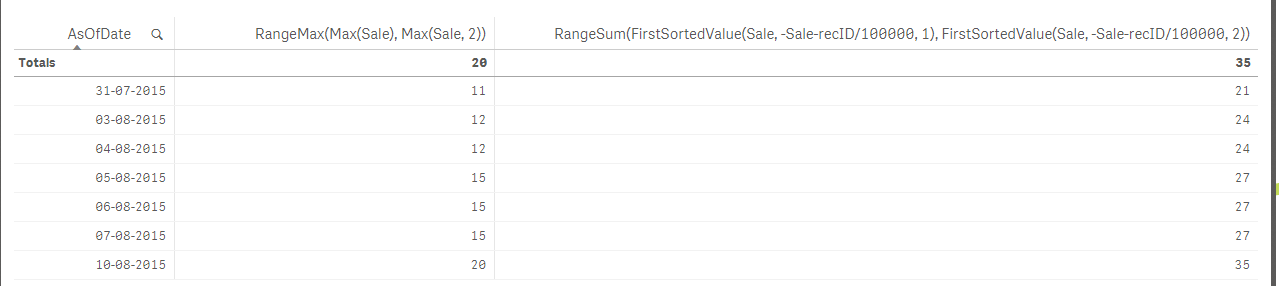
It seems to be working, isn't it?
- Mark as New
- Bookmark
- Subscribe
- Mute
- Subscribe to RSS Feed
- Permalink
- Report Inappropriate Content
Yes Sunny !
It seems to be working perfectly, the part of "Rangesum( FirstSortedValue(Sale, -Sale- recID/100000,1), FirstSortedValue(Sale, -Sale- recID/100000,2))" its amazing.
However, I dont understand -Sale- recID/100000.
I've been all afternoon trying to apply the function to another problem and I could not. Can you explain me ?
Sorry for your time Sunny, I am new in this.
Thank you very very much.
- Mark as New
- Bookmark
- Subscribe
- Mute
- Subscribe to RSS Feed
- Permalink
- Report Inappropriate Content
The second argument -Sale-recID/100000 is the sort weight for the Sales field. It's used to distinguish between ties, i.e. in your sample between the repeated values of 12.
We somehow need QV to find '12' as max number, but also '12' as second largest number in your series of values, e.g. on 03-08-2015.
So I've added a small unique number, record number divided by 100000. (the added number should be much smaller than the smallest difference between your Sale values).
Hope this makes sense,
Stefan
- Mark as New
- Bookmark
- Subscribe
- Mute
- Subscribe to RSS Feed
- Permalink
- Report Inappropriate Content
Thank you very much Stefan
Thank you for your explanations and time!
- « Previous Replies
-
- 1
- 2
- Next Replies »