Unlock a world of possibilities! Login now and discover the exclusive benefits awaiting you.
- Qlik Community
- :
- Forums
- :
- Analytics
- :
- New to Qlik Analytics
- :
- Re: while loop in expression or help for multi-dim...
- Subscribe to RSS Feed
- Mark Topic as New
- Mark Topic as Read
- Float this Topic for Current User
- Bookmark
- Subscribe
- Mute
- Printer Friendly Page
- Mark as New
- Bookmark
- Subscribe
- Mute
- Subscribe to RSS Feed
- Permalink
- Report Inappropriate Content
while loop in expression or help for multi-dimensional combo chart
can I put a while or a for loop into an expression?
I'm trying to make a multi-dimensional combo chart (qlik unfortunately doesn't seem to support it). I'm trying to trick it then do conditional formatting.
for (i = 0; endIterator = 2; i + 1)
If( i = 1, Count(distinct {$
<BINFlagMonth={1}>} {$<[Emp Type]={'P'}>
}
BIN), Count(distinct {$
<BINFlagMonth={1}>} {$<[Emp Type]={'F'}>
}
BIN)
)
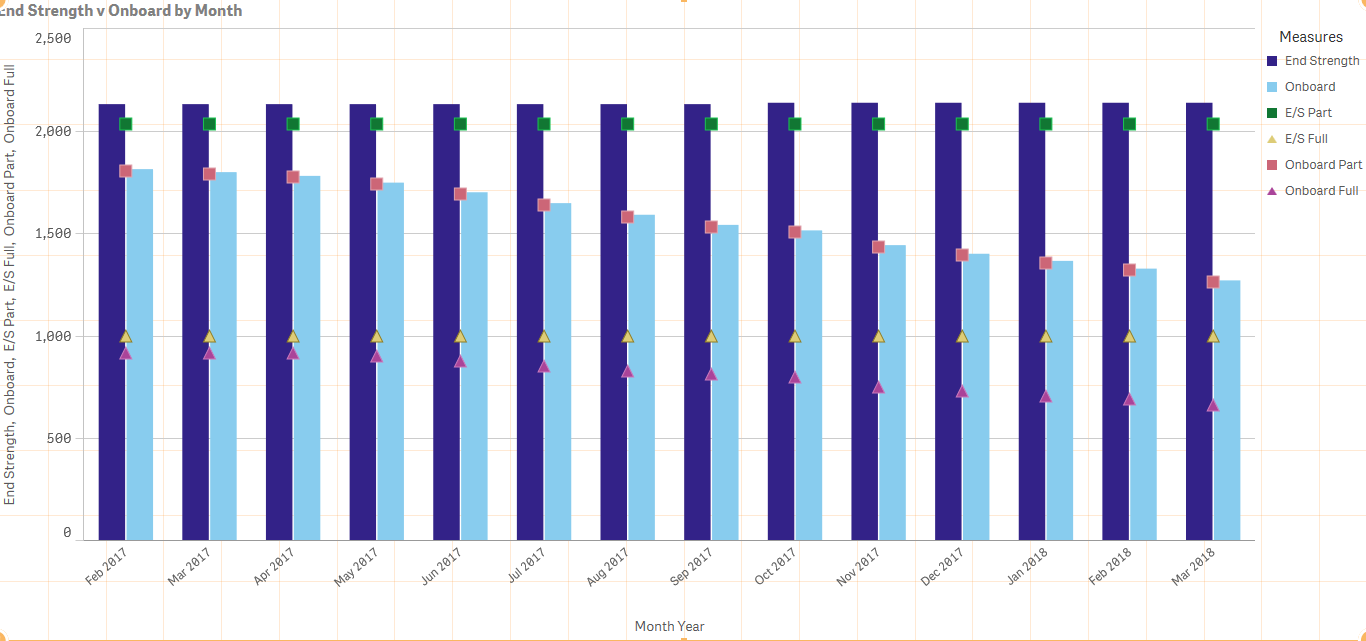
My main dimension is month, and I have 2 measures that I'm displaying, so by month, I'm trying to display total positions available for Parttime v Fulltime (measure one) and the actual staffed parttime v fulltime positions (measure two).. making 2 distinct bars per month and two sub categories within each.
can i do this? please say that it's possible!
- « Previous Replies
-
- 1
- 2
- Next Replies »
- Mark as New
- Bookmark
- Subscribe
- Mute
- Subscribe to RSS Feed
- Permalink
- Report Inappropriate Content
Every chart that i need to make needs to display this type of view... I'm not just showing part-time v full-time.. I'm showing departments and regions and etc.. so i need a viable solution
- Mark as New
- Bookmark
- Subscribe
- Mute
- Subscribe to RSS Feed
- Permalink
- Report Inappropriate Content
Maybe add in Dimension Month and [Emp Type] Field.
Measure: Parttime v Fulltime (measure one)
Measure: Actual staffed parttime v fulltime positions (measure two)
- Mark as New
- Bookmark
- Subscribe
- Mute
- Subscribe to RSS Feed
- Permalink
- Report Inappropriate Content
you can have only 1 dimension on a combo chart i believe.. unless there's some way to trick it?
- Mark as New
- Bookmark
- Subscribe
- Mute
- Subscribe to RSS Feed
- Permalink
- Report Inappropriate Content
Ughhh Qliksense..Can you share some of the data in excel.
- Mark as New
- Bookmark
- Subscribe
- Mute
- Subscribe to RSS Feed
- Permalink
- Report Inappropriate Content
This looks terrible. please help me create the chart that i need! or help me think outside the box to find a better solution..
- Mark as New
- Bookmark
- Subscribe
- Mute
- Subscribe to RSS Feed
- Permalink
- Report Inappropriate Content
I guess you can split your problem into some ones 1) Do you need out of box Visualization? Turn to Qlik branch
2) Do you want a single chart to be responded by values with in dimension , Qlik by default do this, when you select.
- Mark as New
- Bookmark
- Subscribe
- Mute
- Subscribe to RSS Feed
- Permalink
- Report Inappropriate Content
i want the big blue bar to be replaced with the E/S Officer, E/S Enlisted, and E/S Other stacked on top of each other, and i want the ugly green color to be replaced with the onboard officer, onboard enlisted, and onboard not specified. i don't want to have to click to see it all. i want to see it all at once without having to click or drill down.. is that possible??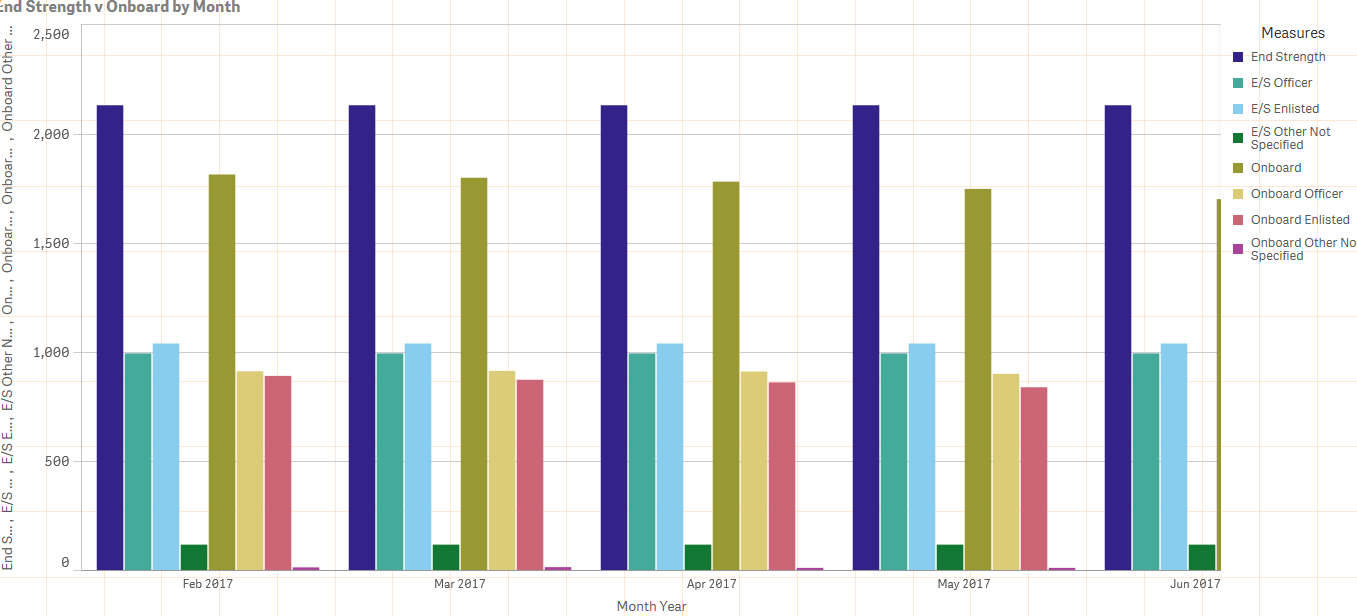
- Mark as New
- Bookmark
- Subscribe
- Mute
- Subscribe to RSS Feed
- Permalink
- Report Inappropriate Content
In two different Stacked Bart charts one with E/S measures other with Onboard measures.
- Mark as New
- Bookmark
- Subscribe
- Mute
- Subscribe to RSS Feed
- Permalink
- Report Inappropriate Content
yes, two stacked bars side by side...one showing E/S slices/stacked and one showing onboard slices/stacked. is this possible?
again, all of my charts need to look like this...so i need to find a viable solution.
- « Previous Replies
-
- 1
- 2
- Next Replies »