Unlock a world of possibilities! Login now and discover the exclusive benefits awaiting you.
- Qlik Community
- :
- All Forums
- :
- QlikView App Dev
- :
- 1 Fact Table, Multiple Date fields, Need a Relatio...
- Subscribe to RSS Feed
- Mark Topic as New
- Mark Topic as Read
- Float this Topic for Current User
- Bookmark
- Subscribe
- Mute
- Printer Friendly Page
- Mark as New
- Bookmark
- Subscribe
- Mute
- Subscribe to RSS Feed
- Permalink
- Report Inappropriate Content
1 Fact Table, Multiple Date fields, Need a Relation
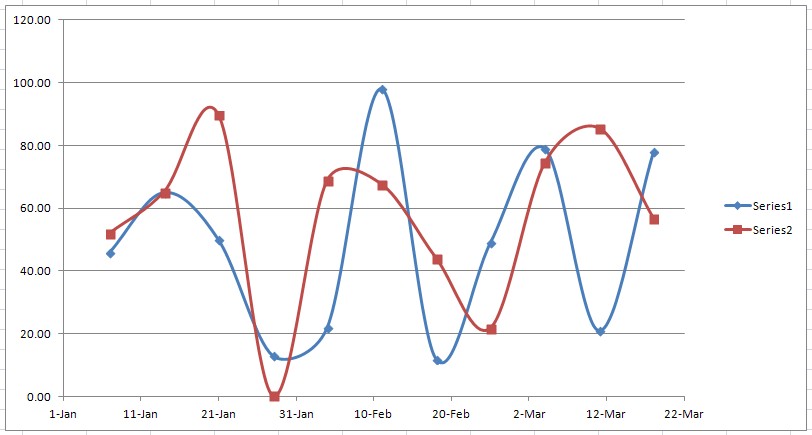
Okay so I have 1 data table with multiple date fields (sample data attached). What I need to do is have one chart where it shows the count of requests for a particular week fall under which date field as shown below. The dimension would be WeekName and Series 1 would be the count(REQUEST_ID) falling under DATE_1, DATE_2 and so on. This way people can see how many were created and how many were completed in a particular week for example.
As you know, I can't use DATE_1 as the dimension, since the counts would have no value. I've gone through many, many posts on here regarding master calendars, link/join/concatenates, etc, etc... nothing seems to fit what I'm trying to do or it's outdated script people had laying around from their QV v6 reports. Any help would be appreciated. Four dates may be a little cumbersome to explain/demonstrate on here so I'd be more than happy with two dates.
- Tags:
- new_to_qlikview
- Mark as New
- Bookmark
- Subscribe
- Mute
- Subscribe to RSS Feed
- Permalink
- Report Inappropriate Content
Try using a CROSSTABLE LOAD prefix to transform your data.
Check attached.
- Mark as New
- Bookmark
- Subscribe
- Mute
- Subscribe to RSS Feed
- Permalink
- Report Inappropriate Content
I'll need help as to where I need to put your code. As you can imagine there's a lot more going on in my table than the vanilla load of 4-5 fields. So I created a new tab and pasted your code in, replacing the FROM info about the spreadsheet you had to my "SERVER.TABLE" info. That didn't work, it said it couldn't find it. Okay, I tried putting the crosstable stuff in the LOAD section of the main statement and that didn't work either.
- Mark as New
- Bookmark
- Subscribe
- Mute
- Subscribe to RSS Feed
- Permalink
- Report Inappropriate Content
First, check the Help for the CROSSTABLE LOAD prefix syntax, you may need to add a third argument to specify the number of qualifier and also the order of fields you are loading in is important (Qualifier fields first).
Besides this, it's hard to tell what's going on without seeing your load script statements.