Unlock a world of possibilities! Login now and discover the exclusive benefits awaiting you.
- Qlik Community
- :
- All Forums
- :
- QlikView App Dev
- :
- 3 Month Volume Loss
- Subscribe to RSS Feed
- Mark Topic as New
- Mark Topic as Read
- Float this Topic for Current User
- Bookmark
- Subscribe
- Mute
- Printer Friendly Page
- Mark as New
- Bookmark
- Subscribe
- Mute
- Subscribe to RSS Feed
- Permalink
- Report Inappropriate Content
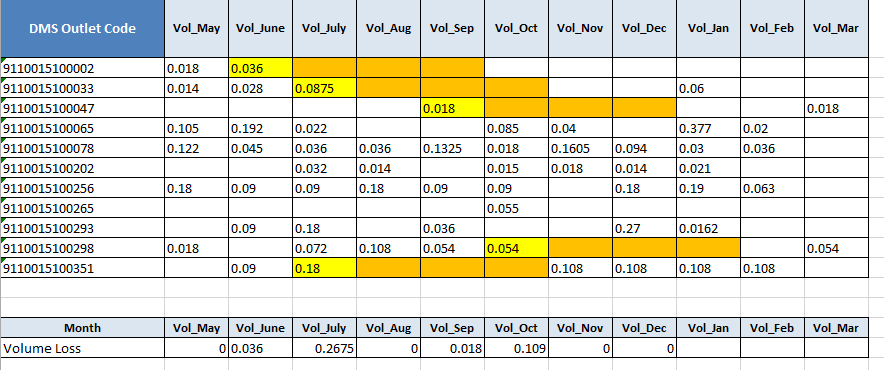
3 Month Volume Loss
Hi Dear Friends i Need Help on Below scenario ,
where in we have Dimension: Month and Measure: Sum(Qty) per Dealer we want to see month on month Volume loss per Dealer.
Suppose in
In May=if(May Qty>0 and (Jun+Jul+ Aug) Qty=0 the Sum(Qty)
In Jun=if(Jun Qty>0 and (Jul+Aug+ Sep) Qty=0 the Sum(Qty) and so on
- Mark as New
- Bookmark
- Subscribe
- Mute
- Subscribe to RSS Feed
- Permalink
- Report Inappropriate Content
In May=if(May Qty>0 and (Jun+Jul+ Aug) Qty=0 the Sum(Qty)
In Jun=if(Jun Qty>0 and (Jul+Aug+ Sep) Qty=0 the Sum(Qty) and so on
Try this?
If(Sum({<Month = {'Vol_May'}>}Qty)>0 and Sum({<Month = {'Vol_Jun','Vol_Jul','Vol_Aug'}>}Qty)=0, Sum(Qty)) as MayQuantity,
If(Sum({<Month = {'Vol_Jun'}>}Qty)>0 and Sum({<Month = {'Vol_Jul','Vol_Aug','Vol_Sep'}>}Qty)=0, Sum(Qty))
as JunQunatity,
.......
- Mark as New
- Bookmark
- Subscribe
- Mute
- Subscribe to RSS Feed
- Permalink
- Report Inappropriate Content
I want to show in charts it's should be dynamic. Monthyear on monthyear
Thanks & Regards,
Anik Hole