Unlock a world of possibilities! Login now and discover the exclusive benefits awaiting you.
- Qlik Community
- :
- All Forums
- :
- QlikView App Dev
- :
- Accumulated percentages in line chart
- Subscribe to RSS Feed
- Mark Topic as New
- Mark Topic as Read
- Float this Topic for Current User
- Bookmark
- Subscribe
- Mute
- Printer Friendly Page
- Mark as New
- Bookmark
- Subscribe
- Mute
- Subscribe to RSS Feed
- Permalink
- Report Inappropriate Content
Accumulated percentages in line chart
Dear all
I've encountered a problem which I don't know the answer to.
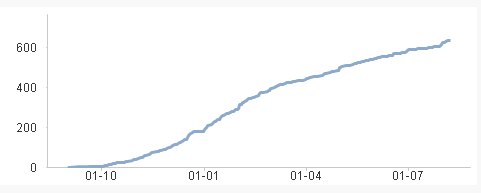
I wan't to follow student dropout ratio in the first year of their study in a line chart. 1.9.2012 4.969 students started on a bachelors degree at the University. From my data I can see their study status (active or dropout) and if they are dropouts, I can see on which date they left the University.
It's easy for me to make a line chart on the accumultated dropout (se image, expression=count({$<student_status={'dropout'}>} distinct student_id) ), but I can't figure out how to show the accumulated percentage of dropouts vs. the entire population (4.969 students). I tried to tick off "Relative" in the expressions menu, but its not working.
I've attached an excel version of my data if this could be usefull.
Can anyone help me?
Thanks in advance 
Cheers
Bruno
- Tags:
- new_to_qlikview
Accepted Solutions
- Mark as New
- Bookmark
- Subscribe
- Mute
- Subscribe to RSS Feed
- Permalink
- Report Inappropriate Content
Try count({<Status_on_education={'Dropout'}>}Student_id)/ count(total Student_id)
talk is cheap, supply exceeds demand
- Mark as New
- Bookmark
- Subscribe
- Mute
- Subscribe to RSS Feed
- Permalink
- Report Inappropriate Content
Try count({<Status_on_education={'Dropout'}>}Student_id)/ count(total Student_id)
talk is cheap, supply exceeds demand
- Mark as New
- Bookmark
- Subscribe
- Mute
- Subscribe to RSS Feed
- Permalink
- Report Inappropriate Content
Thanks Gysbert
It works perfect.
However I've just been told to have last years dropout on the chart as well. Something like this:
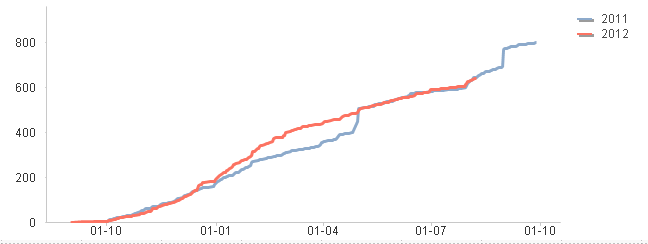
When I use your expression on a chart with both years, the percentages are halved (propably because of the "total student_id" I guess). The Year are a new variable and for dropoutdate for students who where enrolled in 2011, I used the dropoutdate+365 days so 2011 and 2012 would come out on the same chart.
Can this be done relatively easy?
Again - Thanks
Bruno