Unlock a world of possibilities! Login now and discover the exclusive benefits awaiting you.
- Qlik Community
- :
- All Forums
- :
- QlikView App Dev
- :
- Accumulated values in Pivot Tables
- Subscribe to RSS Feed
- Mark Topic as New
- Mark Topic as Read
- Float this Topic for Current User
- Bookmark
- Subscribe
- Mute
- Printer Friendly Page
- Mark as New
- Bookmark
- Subscribe
- Mute
- Subscribe to RSS Feed
- Permalink
- Report Inappropriate Content
Accumulated values in Pivot Tables
Hi,
I'm trying to apply accumulated values in a pivot table.
I partially achieved what i wanted by using the statement:
(Above(TOTAL sum({$<Ano={2013},Mes={'jan','fev','mar','abr','mai','jun','jul','ago','set','out','nov','dez'},Dia={1,2,3,4,5,6,7,8,9,10,11,12,13,14,15,16,17,18,19,20,21,22,23,24,25,26,27,28,29,30,31}>} (Valor_XPTO)), 0, Rowno(TOTAL)))
... where 'Mês' is the month and 'Dia' is the day.
I applied this statement every month and days so that the value remains the same regardless of a filter be selected per month or per day.
I applied this instruction in the last two columns of the following pivot table:
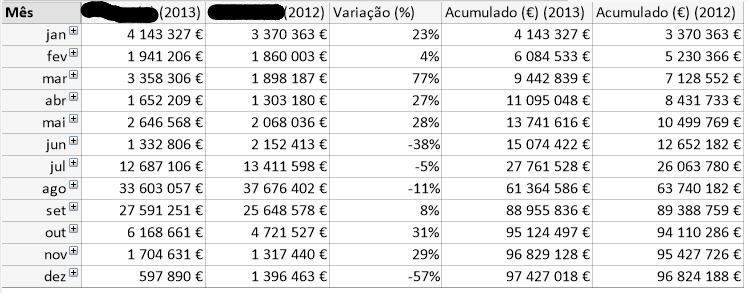
But when i expand any node of months, the cumulative value is automatically recalculated starting on the first day of that month (with the remaining months with these columns to zero😞
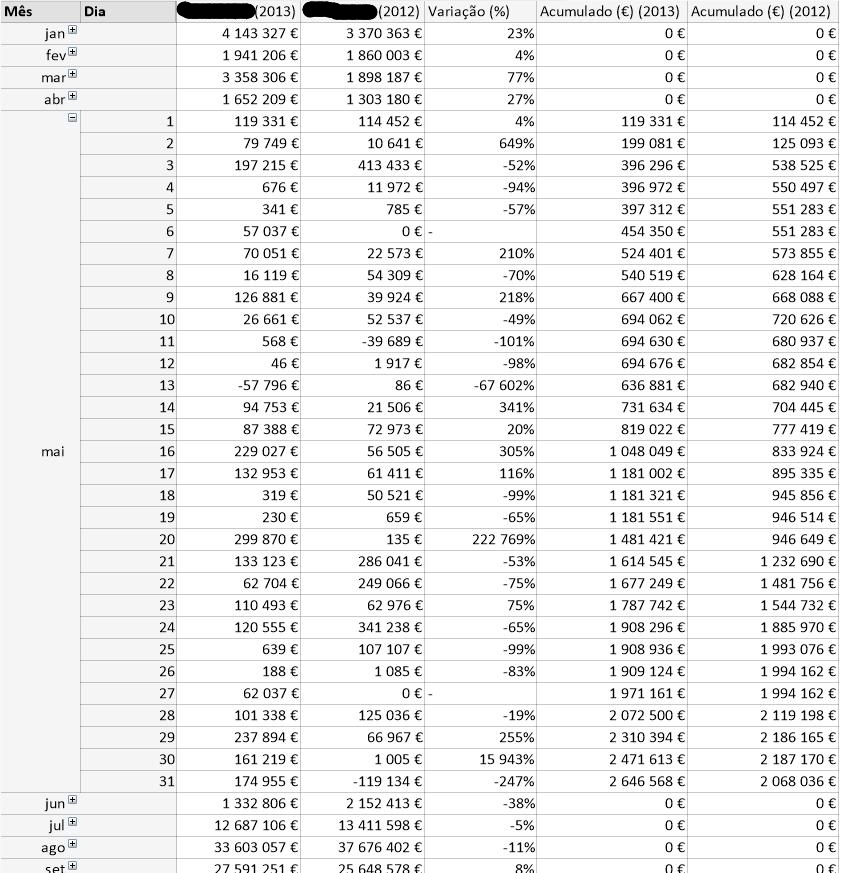
The objective is that, in the above example, the accumulated value of the months should remain displayed (instead of zero) while the accumulated value for May 1 should consider the cumulative value of April (as well as the month of June consider the accumulated value of May 31).
Someone please can help me solve this problem?
Thank you.
Eduardo Ribeiro.
Someone please can help me solve this problem?
Thank you.
- Mark as New
- Bookmark
- Subscribe
- Mute
- Subscribe to RSS Feed
- Permalink
- Report Inappropriate Content
I think you'll need to use an AsOf table. See this document: Calculating rolling n-period totals, averages or other aggregations.
The AsOf Table Examples.qvw document has a pivot table on Sheet1 that can show what you want (albeit at year and month level instead of month and day, but the principle is the same). Drag the Year dimension to the left of the Month dimension and look at the totals. Then expand 2009 and you'll see that the cumulative values are still displayed and correct.
talk is cheap, supply exceeds demand