Unlock a world of possibilities! Login now and discover the exclusive benefits awaiting you.
- Qlik Community
- :
- All Forums
- :
- QlikView App Dev
- :
- Add two rows in pivot table & straight table
- Subscribe to RSS Feed
- Mark Topic as New
- Mark Topic as Read
- Float this Topic for Current User
- Bookmark
- Subscribe
- Mute
- Printer Friendly Page
- Mark as New
- Bookmark
- Subscribe
- Mute
- Subscribe to RSS Feed
- Permalink
- Report Inappropriate Content
Add two rows in pivot table & straight table
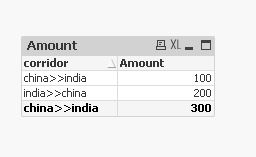
I have to add two different rows of the same column in a pivot table & straight table and put the data in the same row. for eg. below there are two rows china>>india and india>>china and 3rd row represent the sum of the above two row(in red).
| corridor | amount |
|---|---|
| china>>india | 100 |
| india>>china | 200 |
| china>>india | 300 |
- « Previous Replies
-
- 1
- 2
- Next Replies »
- Mark as New
- Bookmark
- Subscribe
- Mute
- Subscribe to RSS Feed
- Permalink
- Report Inappropriate Content
Put total in last row and provide label name
- Mark as New
- Bookmark
- Subscribe
- Mute
- Subscribe to RSS Feed
- Permalink
- Report Inappropriate Content
Hi shivesh,
I don't want total I want to add two and put them into another row
- Mark as New
- Bookmark
- Subscribe
- Mute
- Subscribe to RSS Feed
- Permalink
- Report Inappropriate Content
May be provide 10 Rows and expected result set as this won't met simple solution
- Mark as New
- Bookmark
- Subscribe
- Mute
- Subscribe to RSS Feed
- Permalink
- Report Inappropriate Content
PFA
- Mark as New
- Bookmark
- Subscribe
- Mute
- Subscribe to RSS Feed
- Permalink
- Report Inappropriate Content
Hi anil,
I have data of trade corridor from one country to another and vice a versa. for eg. China>>UK, UK>>china and so on. Now I have to make a pivot table in which I need to show the data for top 10 corridors which I decide from my side which corridor has to be shown there. Now the one corridor in that can be India>>US but I want this should contains value of India>>US + US >> India both. I mean sum of the forward and backward flow. How can I do that ? for eg
india >> US = 200
US >> india = 300
china >> hong kong = 100
hong kong >> china 50
UK >> US =60
US >> UK = 90
then in the pivot table I should get
india >> US = 500
china >> hong kong = 150
UK >> US =150
summation of the both side trade flow should be there in one row
thank you
- Mark as New
- Bookmark
- Subscribe
- Mute
- Subscribe to RSS Feed
- Permalink
- Report Inappropriate Content
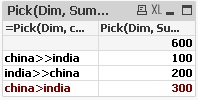
Try like below:
Tab:
Load * Inline [
corridor,amount
china>>india,100
india>>china,200
china>>india,300
];
Tab_1:
Load
corridor,
sum(amount) as Sum_Amount
Resident Tab
Group by corridor;
Drop Table Tab;
dimension
corridor
Expression
Sum(Sum_Amount)
- Mark as New
- Bookmark
- Subscribe
- Mute
- Subscribe to RSS Feed
- Permalink
- Report Inappropriate Content
Hi chennaiah,
I don't need the sum of the same corridor rather I need the sum of the forward and backward flow corridor.
for eg.
india >> US = 200
US >> india = 300
china >> hong kong = 100
hong kong >> china 50
UK >> US =60
US >> UK = 90
then in the pivot table I should get
india >> US = 500 = india>>US + US>> india
china >> hong kong = 150 = china>> hong kong + Hong kong>> china
UK >> US =150 = UK >> US + US>>UK
- Mark as New
- Bookmark
- Subscribe
- Mute
- Subscribe to RSS Feed
- Permalink
- Report Inappropriate Content
The left side part data comes from Field? I can think something like below
If(SubField(FieldName, '>>', -1) = SubField(FieldName, '>>', 1), Sum(Measure))
OR
If(SubField(FieldName, '>>', -1) = SubField(FieldName, '>>', 1), 1,0) as Flag
and measure should be
Sum({<Flag = {1}>} Measure)
- Mark as New
- Bookmark
- Subscribe
- Mute
- Subscribe to RSS Feed
- Permalink
- Report Inappropriate Content
Hi anil,
thank you but it is not giving the required result.
- « Previous Replies
-
- 1
- 2
- Next Replies »