Unlock a world of possibilities! Login now and discover the exclusive benefits awaiting you.
- Qlik Community
- :
- All Forums
- :
- QlikView App Dev
- :
- Re: Adding a new dimension to pivot table
- Subscribe to RSS Feed
- Mark Topic as New
- Mark Topic as Read
- Float this Topic for Current User
- Bookmark
- Subscribe
- Mute
- Printer Friendly Page
- Mark as New
- Bookmark
- Subscribe
- Mute
- Subscribe to RSS Feed
- Permalink
- Report Inappropriate Content
Adding a new dimension to pivot table
Hi,
Currently, I have the following data presented in listbox in qlikview as follows:
Where complexity is being defined as an expression such that: simple: timetaken<11, average: 11 <timetaken<20, complex >20
| complexity | category | timetaken |
| simple | A | 8 |
| complex | B | 30 |
| average | C | 17 |
| simple | D | 9 |
| complex | E | 25 |
May I know if there is anyway to put this into a pivot table such that the first dimension will be complexity, followed by category, and the expression will be timetaken?
I tried taking the same expression for complexity and copy into the calculated dimension in pivot table. but it shows calculation error.
P.S: Please do not attach qlikview files, I cant seem to download and view it on my qlikview.
Thanks
- « Previous Replies
-
- 1
- 2
- Next Replies »
- Mark as New
- Bookmark
- Subscribe
- Mute
- Subscribe to RSS Feed
- Permalink
- Report Inappropriate Content
The cleanest way to do this is to build the 'complexity' field in the script. If there is no aggregation function in the expression then you could use a calculated dimension.
You cannot use aggregation fields in the dimension field of a chart so if that is what you need to do then you have a more complex issue.
- Mark as New
- Bookmark
- Subscribe
- Mute
- Subscribe to RSS Feed
- Permalink
- Report Inappropriate Content
could you show me how to build the complexity field in the script?
Currently my code are:
Load
Category,
timetaken
FROM<>
where and how should I create a new field?
Would really appreciate if you would be able to type out the coding to it?
Thanks
- Mark as New
- Bookmark
- Subscribe
- Mute
- Subscribe to RSS Feed
- Permalink
- Report Inappropriate Content
If I assume category and timetaken as fields, you may do like this -
- Mark as New
- Bookmark
- Subscribe
- Mute
- Subscribe to RSS Feed
- Permalink
- Report Inappropriate Content
may I know what table is this? and where do you key in the codes(the dimension or expression field?
but if I were to do in this table, I would not be able to get the categories which are classified under simple, and the corresponding timetaken.
- Mark as New
- Bookmark
- Subscribe
- Mute
- Subscribe to RSS Feed
- Permalink
- Report Inappropriate Content
oh. right. im sorry. I didn't see it correctly. yes. your table is the pivot table im looking at. But I have no idea, where should I type the code in.
should I type it in add in dimension>> add calculated dimension?
- Mark as New
- Bookmark
- Subscribe
- Mute
- Subscribe to RSS Feed
- Permalink
- Report Inappropriate Content
What all are your dimension and expressions here?
- Mark as New
- Bookmark
- Subscribe
- Mute
- Subscribe to RSS Feed
- Permalink
- Report Inappropriate Content
Oh, I think I missed your messages, see the attached sample which I used here -
sample script is -
Load * inline [
Category, timetaken
A, 8
B, 30
C, 17
D, 9
E, 25 ];
- Mark as New
- Bookmark
- Subscribe
- Mute
- Subscribe to RSS Feed
- Permalink
- Report Inappropriate Content
there is no sample attached. And please do not attach any sample. i can't seem to download and open qv file.
yea. i would like to know how to know. how to obtain this part of the pivot table, if one only has the category and time taken on hand.
- Mark as New
- Bookmark
- Subscribe
- Mute
- Subscribe to RSS Feed
- Permalink
- Report Inappropriate Content
This expression added as dimension is called calculated dimension, here are steps to create it -
Step 1 - Right click and select properties option of Pivot table chart
Step 2- Click on Dimension tab
Step 3 - Click on 'Add Calculated Dimension' button in the Upper right section
Step 4 - Add following expression here -
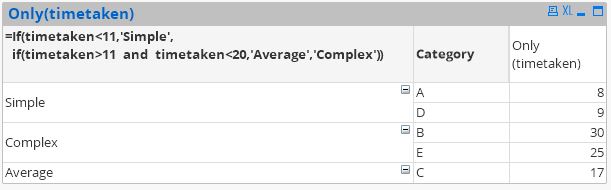
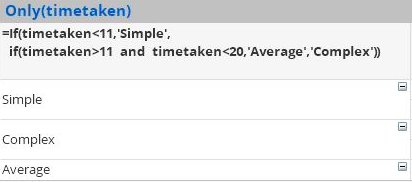
=If(timetaken<11,'Simple',
if(timetaken>11 and timetaken<20,'Average','Complex'))
Step 5 - Add second dimension Category ( I assume you have reloaded the script by now and able to see Category in dimension list)
Step 6 - Go to expression tab and add the expression - Only(timetaken)
I think you are done to see the results I have pasted in last post of mine.
- « Previous Replies
-
- 1
- 2
- Next Replies »