Unlock a world of possibilities! Login now and discover the exclusive benefits awaiting you.
Announcements
Live today at 11 AM ET. Get your questions about Qlik Connect answered, or just listen in.
SIGN UP NOW
- Qlik Community
- :
- All Forums
- :
- QlikView App Dev
- :
- Adding another dimension on chart
Options
- Subscribe to RSS Feed
- Mark Topic as New
- Mark Topic as Read
- Float this Topic for Current User
- Bookmark
- Subscribe
- Mute
- Printer Friendly Page
Turn on suggestions
Auto-suggest helps you quickly narrow down your search results by suggesting possible matches as you type.
Showing results for
Creator
2017-01-12
06:50 AM
- Mark as New
- Bookmark
- Subscribe
- Mute
- Subscribe to RSS Feed
- Permalink
- Report Inappropriate Content
Adding another dimension on chart
Hi there,
I'm trying to add a dimension on the right of the graph that has a scale that the line can read off.
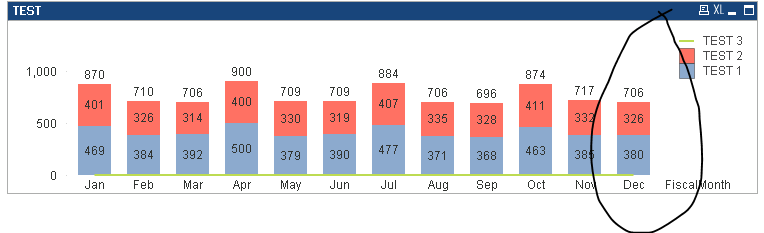
As the green line has a different scale to what the bars are reading from on the left.
Is this possible in QlikView?
1,592 Views
1 Solution
Accepted Solutions
MVP
2017-01-12
07:04 AM
- Mark as New
- Bookmark
- Subscribe
- Mute
- Subscribe to RSS Feed
- Permalink
- Report Inappropriate Content
You just need to create a axis on the right which can be done on the Axes tab. Check this link out:
1,534 Views
2 Replies
Not applicable
2017-01-12
06:52 AM
- Mark as New
- Bookmark
- Subscribe
- Mute
- Subscribe to RSS Feed
- Permalink
- Report Inappropriate Content
Please share us a sample file and elaborate your requirement clearly.
1,534 Views
MVP
2017-01-12
07:04 AM
- Mark as New
- Bookmark
- Subscribe
- Mute
- Subscribe to RSS Feed
- Permalink
- Report Inappropriate Content
You just need to create a axis on the right which can be done on the Axes tab. Check this link out:
1,535 Views