Unlock a world of possibilities! Login now and discover the exclusive benefits awaiting you.
- Qlik Community
- :
- All Forums
- :
- QlikView App Dev
- :
- Re: Additional Sorting within Bar Chart
- Subscribe to RSS Feed
- Mark Topic as New
- Mark Topic as Read
- Float this Topic for Current User
- Bookmark
- Subscribe
- Mute
- Printer Friendly Page
- Mark as New
- Bookmark
- Subscribe
- Mute
- Subscribe to RSS Feed
- Permalink
- Report Inappropriate Content
Additional Sorting within Bar Chart
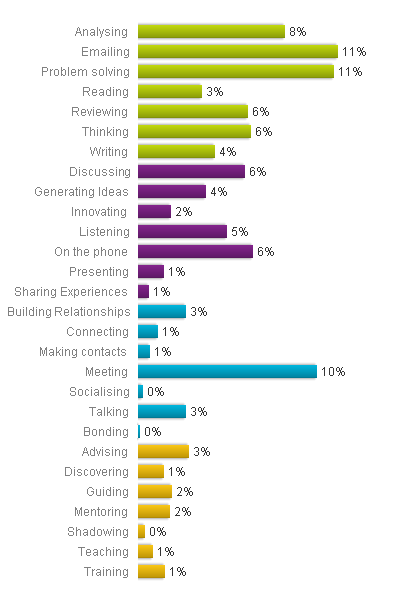
Hi, I have been trying to get this chart arranged in a certain way - got so far and then I'm stuck!
Any help is appreciated.
I have used the following sort calculation to organise the data in the chart below:
This organises the workmodes into the order required
=Only({1} Match(response_level1,'Focus','Collaborate','Network','Develop'))
I would like to sort the Activities within each Workmode in descending order!
Thanks
Rob
Accepted Solutions
- Mark as New
- Bookmark
- Subscribe
- Mute
- Subscribe to RSS Feed
- Permalink
- Report Inappropriate Content
Try something like
= -Match(response_level1,'Focus','Collaborate','Network','Develop') *FieldValueCount('ChartDimension') +rank(sum(Value))
where ChartDimension is the field name you use as dimension in your chart and sum(Value) is the expression you are using.
- Mark as New
- Bookmark
- Subscribe
- Mute
- Subscribe to RSS Feed
- Permalink
- Report Inappropriate Content
Hi swuehl, that's the answer! - I had to reverse the order of the response level to get the chart to work in the right order.
= -Match(response_level1,'Develop','Network','Collaborate','Focus') *FieldValueCount('percentsplit') +rank(sum(percentsplit))
Just setting the colours to match and it's done.
Thanks
Rob
- Mark as New
- Bookmark
- Subscribe
- Mute
- Subscribe to RSS Feed
- Permalink
- Report Inappropriate Content
Ah, yes, I think removing the first minus sign should also correct for the right sorting:
= Match(response_level1,'Focus','Collaborate','Network','Develop')*FieldValueCount('ChartDimension') +rank(sum(Value))
Regards,
Stefan
- Mark as New
- Bookmark
- Subscribe
- Mute
- Subscribe to RSS Feed
- Permalink
- Report Inappropriate Content
Yes that did it, good to know.
Thanks
Rob