Unlock a world of possibilities! Login now and discover the exclusive benefits awaiting you.
- Qlik Community
- :
- All Forums
- :
- QlikView App Dev
- :
- Re: Aggr in Listbox
- Subscribe to RSS Feed
- Mark Topic as New
- Mark Topic as Read
- Float this Topic for Current User
- Bookmark
- Subscribe
- Mute
- Printer Friendly Page
- Mark as New
- Bookmark
- Subscribe
- Mute
- Subscribe to RSS Feed
- Permalink
- Report Inappropriate Content
Aggr in Listbox
Hi All,
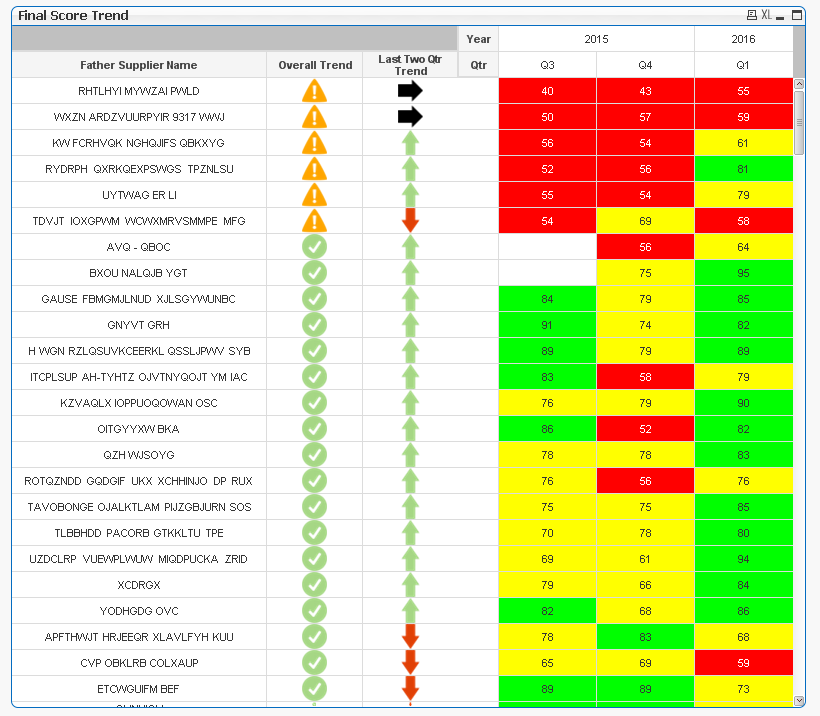
I have a pivot table that display trands,
with two calculated dimensions "Overall Trend" and "Last Two Qtr Trend"
I am using bundle info to show pics insted of values,
now the client wants this pics as filters that hew can use on the side,
"Overall Trend" calculated dimension in the table:
=aggr(if(sum(AttentionFlag)>=2,Only({$<Alabet={'a'}>}info(Alabet)),Only({$<Alabet={'b'}>}info(Alabet))),[Father Supplier Name])
"Overall Trend" calculated dimension in the listbox:
=aggr(if(sum(AttentionFlag)>=2,Only({$<[Father Supplier Name]=,Alabet={'a'}>}info(Alabet)),Only({$<[Father Supplier Name]=,Alabet={'b'}>}info(Alabet))),[Father Supplier Name])
the calculation in the listbox keep excluding the other picture,
See th Attached.
help is appreciated.
thanks.
- Mark as New
- Bookmark
- Subscribe
- Mute
- Subscribe to RSS Feed
- Permalink
- Report Inappropriate Content
Sample Attached.
- Mark as New
- Bookmark
- Subscribe
- Mute
- Subscribe to RSS Feed
- Permalink
- Report Inappropriate Content
I think its time we get the experts involved here. May be swuehl can offer you his expert advice
- Mark as New
- Bookmark
- Subscribe
- Mute
- Subscribe to RSS Feed
- Permalink
- Report Inappropriate Content
Maybe like attached?
![2016-06-09 00_23_15-QlikView x64 - [C__Users_Stefan_Downloads_Trend_2.qvw].png](/legacyfs/online/127312_2016-06-09 00_23_15-QlikView x64 - [C__Users_Stefan_Downloads_Trend_2.qvw].png)
- Mark as New
- Bookmark
- Subscribe
- Mute
- Subscribe to RSS Feed
- Permalink
- Report Inappropriate Content
Stefan I am on a mobile device and I can't wait to see what the solution would be. Do you mind posting the expression/s?
- Mark as New
- Bookmark
- Subscribe
- Mute
- Subscribe to RSS Feed
- Permalink
- Report Inappropriate Content
I am basically using an alternate state AS1 for the second list box and then use
=aggr(only({<AttentionSign-={'a'},[Father Supplier Name]=,[Year-Qtr-Num]={'$(=max({$}[Year-Qtr-Num]))'}>}info(AttentionSign)),[Father Supplier Name])
and as expression in the chart
=AVG({$*AS1}[Final Score])
there currently might be some minor open issue with regard to e.g. selections in time (not sure how the requirements are here, the current list box 1 also seems to not show the correct filter options when e.g. selecting a quarter).
- Mark as New
- Bookmark
- Subscribe
- Mute
- Subscribe to RSS Feed
- Permalink
- Report Inappropriate Content
No way to create this list box without using the if statement? I think the issue is related to the if statement getting triggered on selection and might be avoided if we can avoid the if statement.
- Mark as New
- Bookmark
- Subscribe
- Mute
- Subscribe to RSS Feed
- Permalink
- Report Inappropriate Content
thank you very much guys very very impressive.
now i have one more issues:
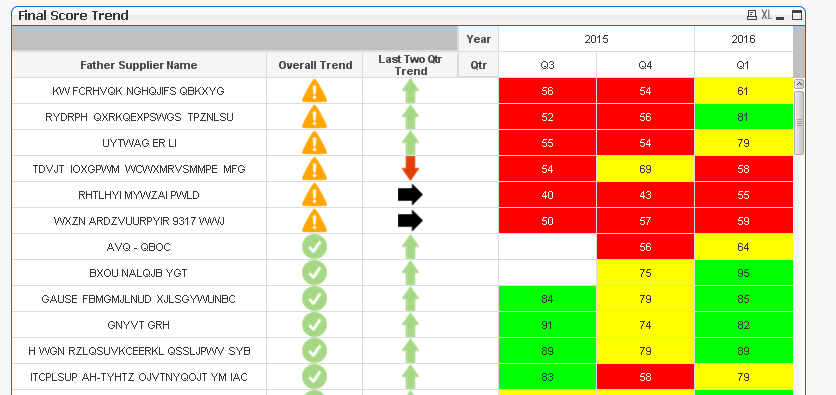
the client also want the table to be sorted i managed to sort the "Overall Trend" but need to sort "Last Two Qtr Trend"
(the arrows).
again thank you very very much !
- Mark as New
- Bookmark
- Subscribe
- Mute
- Subscribe to RSS Feed
- Permalink
- Report Inappropriate Content
May be sort using this:
RangeSum(If(Sum(AttentionFlag) = 0, 100000, Sum(AttentionFlag)*100000), ORD(Only({$<[Year-Qtr-Num]={'$(=max([Year-Qtr-Num]))'}>} AttentionSign)))
- Mark as New
- Bookmark
- Subscribe
- Mute
- Subscribe to RSS Feed
- Permalink
- Report Inappropriate Content
Or this:
RangeSum(If(Sum(AttentionFlag) = 0 or Sum(AttentionFlag) = 1, 100000, 200000), ORD(Only({$<[Year-Qtr-Num]={'$(=max([Year-Qtr-Num]))'}>} AttentionSign)))
- Mark as New
- Bookmark
- Subscribe
- Mute
- Subscribe to RSS Feed
- Permalink
- Report Inappropriate Content
Thanks Sunny, it seems to work in the sample but not in the model itself (it is better then what it was)
can you take another look at the new attached - i didn't realize the model was so small the first time.
so here is the not reduced model.
Many thanks.