Unlock a world of possibilities! Login now and discover the exclusive benefits awaiting you.
- Qlik Community
- :
- All Forums
- :
- QlikView App Dev
- :
- Aggregation of Ids for a particular date in combo ...
- Subscribe to RSS Feed
- Mark Topic as New
- Mark Topic as Read
- Float this Topic for Current User
- Bookmark
- Subscribe
- Mute
- Printer Friendly Page
- Mark as New
- Bookmark
- Subscribe
- Mute
- Subscribe to RSS Feed
- Permalink
- Report Inappropriate Content
Aggregation of Ids for a particular date in combo chart
I want to represent set of ids which are linked to a date, with symbols for the ids and a vertical line for the date.
I have attached a qvw file where the I'm able to represent the symbols for a particular date. But I want to draw a vertical line over the symbols as a reference for the date. ie., I wanna combine both the charts together and represent the symbols for the all the dates present.
Any help?
Accepted Solutions
- Mark as New
- Bookmark
- Subscribe
- Mute
- Subscribe to RSS Feed
- Permalink
- Report Inappropriate Content
Hi,
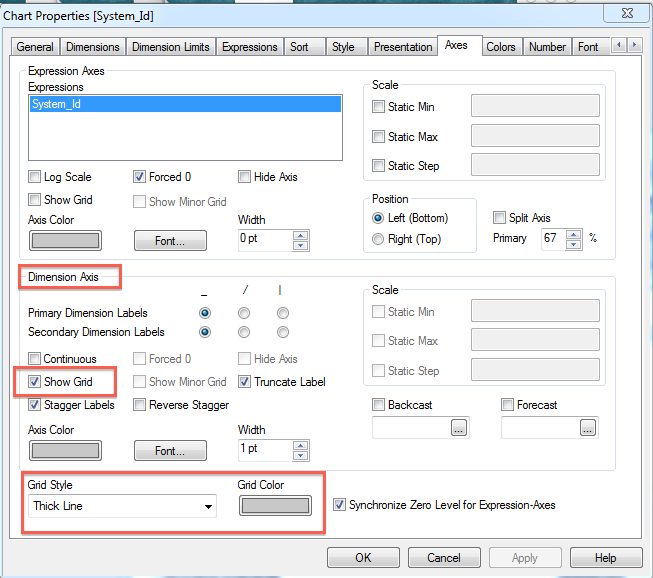
Right click on your chart containing symbols and go to properties > axis
Here enable show grid checkbox under dimension axis. The grid line thickness, style and colour can be customised from the drop down at the bottom of the axis properties screen..see screenshot below..hope this helps
- Mark as New
- Bookmark
- Subscribe
- Mute
- Subscribe to RSS Feed
- Permalink
- Report Inappropriate Content
Hi,
Right click on your chart containing symbols and go to properties > axis
Here enable show grid checkbox under dimension axis. The grid line thickness, style and colour can be customised from the drop down at the bottom of the axis properties screen..see screenshot below..hope this helps
- Mark as New
- Bookmark
- Subscribe
- Mute
- Subscribe to RSS Feed
- Permalink
- Report Inappropriate Content
Thank you so much! This works 
But when no filter selection is made, I want all the dates to displayed by default also with their Ids incorporating your above solution. Is there a way to do that too?
- Mark as New
- Bookmark
- Subscribe
- Mute
- Subscribe to RSS Feed
- Permalink
- Report Inappropriate Content
Perhaps not very sure how to though.
- Mark as New
- Bookmark
- Subscribe
- Mute
- Subscribe to RSS Feed
- Permalink
- Report Inappropriate Content
Thanks for trying Sana !
If anyone else knows how to do this, please do let me know !