Unlock a world of possibilities! Login now and discover the exclusive benefits awaiting you.
- Qlik Community
- :
- All Forums
- :
- QlikView App Dev
- :
- Re: Aggregation with FirstSortedValue
- Subscribe to RSS Feed
- Mark Topic as New
- Mark Topic as Read
- Float this Topic for Current User
- Bookmark
- Subscribe
- Mute
- Printer Friendly Page
- Mark as New
- Bookmark
- Subscribe
- Mute
- Subscribe to RSS Feed
- Permalink
- Report Inappropriate Content
Aggregation with FirstSortedValue
Hello Everyone,
Here is an example of my data set (it is much larger):
estimate_number est_rev_nbr description amount
307 0 Hotel 500
307 1 Hotel 1000
307 2 Hotel 1500
307 0 Flight 200
307 1 Flight 300
307 2 Flight 400
307 3 Flight 500
The max est_rev_nbr is different depending on the description. I am looking to get Hotel($1500) and Flight($500), and there are many more components not shown here. I would also like this in a Pivot Table visualization as a measure, so I was using "sum" to just give me the value. I was thinking something like:
sum(FirstSortedValue(amount, -est_rev_nbr)
I appreciate any help with this.
Thanks,
Ben
Accepted Solutions
- Mark as New
- Bookmark
- Subscribe
- Mute
- Subscribe to RSS Feed
- Permalink
- Report Inappropriate Content
May be this
Sum(Aggr(FirstSortedValue(amount, -est_rev_nbr), description))
- Mark as New
- Bookmark
- Subscribe
- Mute
- Subscribe to RSS Feed
- Permalink
- Report Inappropriate Content
May be this
Sum(Aggr(FirstSortedValue(amount, -est_rev_nbr), description))
- Mark as New
- Bookmark
- Subscribe
- Mute
- Subscribe to RSS Feed
- Permalink
- Report Inappropriate Content
Sunny,
You are always such a great help! Thanks for the swift, and correct response!
- Mark as New
- Bookmark
- Subscribe
- Mute
- Subscribe to RSS Feed
- Permalink
- Report Inappropriate Content
Sunny,
I know it has been some time, and not sure if you get a notification with this reply, but figure it is worth a shot. Your formula above works great for the main use case, which is a KPI queried by an internal job code. It doesn't seem to work in a table visualization though, and there is no query (shows all of the internal jobs in list form). I have tried a bunch of other things, and can't get it to work. Is there a different formula that would work for a table?
P.S. For the data above, there is a job_code (say 9000), that would be at the beginning of each row.
Thanks in advance, and I will try the community if I don't hear back from you.
Ben
- Mark as New
- Bookmark
- Subscribe
- Mute
- Subscribe to RSS Feed
- Permalink
- Report Inappropriate Content
Would you be able to share more information? like what is your dimensions? May be share a sample if possible
- Mark as New
- Bookmark
- Subscribe
- Mute
- Subscribe to RSS Feed
- Permalink
- Report Inappropriate Content
All of the fields above/below are dimensions. I believe the issue is that the est_rev_nbr can be different for every estimate number. If we redo a budget, the est_rev_nbr will go up by 1. Some jobs have one estimate, and some have 4 or 5. Here is a better data sample (I am not sure how qvf's work, but can attach an excel spreadsheet if needed):
job_number estimate_number est_rev_nbr description amount
1000 307 0 Hotel 500
1000 307 1 Hotel 1000
1000 307 2 Hotel 1500
1000 307 0 Flight 200
1000 307 1 Flight 300
2000 311 0 Food 750
2000 311 1 Food 1100
2000 311 0 Flight 400
2000 311 1 Flight 300
3000 411 0 Flight 900
3000 411 0 Food 1750
There are 3 different jobs here. My desired output is (not in this format):
1000 Hotel: $1500
2000 Food: $1100
Flight: $300
Total(sum): $1400
3000 Flight: $900
Food: $1750
Total(sum): $2650
You will notice that the max(est_rev_nbr) is different, depending on the estimate/job_number. I only need the description amount from the max(est_rev_nbr), so you will see that the "Flight" actually drops off from job_number 1000 since Flight doesn't have an est_rev_nbr of 2. I believe the formula you gave me before, takes the highest est_rev_nbr across the whole data set, and only uses those (which is how I did originally ask the question). I am thinking I need one more aggr or comma in your original equation, so it calculates the firstsortedvalue (or lastsortedvalue in this case) for each estimate_number. I hope this all makes sense.
P.S. Someone else offered this for a possible fix, but it only works in certain cases also. In this example,
Quote_number = est_rev_nbr
Estimate = amount
= Sum({<Quote_number = {"= Max(Quote_number)"} >} Estimate)
OR
= Sum(Aggr(Sum({<Quote_number = {"= Max(Quote_number)"} >} Estimate), Description))
Thanks, as always, for your help,
Ben
- Mark as New
- Bookmark
- Subscribe
- Mute
- Subscribe to RSS Feed
- Permalink
- Report Inappropriate Content
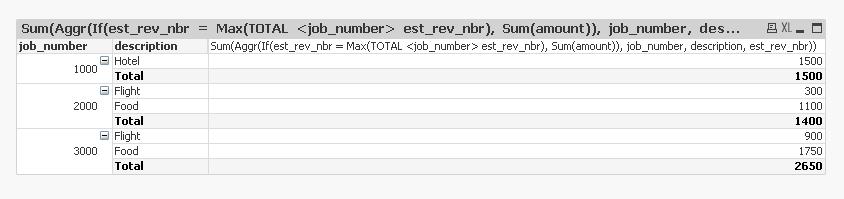
Try this
Sum(Aggr(If(est_rev_nbr = Max(TOTAL <job_number> est_rev_nbr), Sum(amount)), job_number, description, est_rev_nbr))
- Mark as New
- Bookmark
- Subscribe
- Mute
- Subscribe to RSS Feed
- Permalink
- Report Inappropriate Content
Sunny, thank you! This is exactly what I needed. I really appreciate your help with this. I was in all day meetings yesterday, and was dying to try it out. I went to my first Qlik conference this year, and plan on going from here on out. I would like to thank you in person some time, if you attend these.