Unlock a world of possibilities! Login now and discover the exclusive benefits awaiting you.
- Qlik Community
- :
- All Forums
- :
- QlikView App Dev
- :
- Re: Aligning Alternate State trend lines in Line c...
- Subscribe to RSS Feed
- Mark Topic as New
- Mark Topic as Read
- Float this Topic for Current User
- Bookmark
- Subscribe
- Mute
- Printer Friendly Page
- Mark as New
- Bookmark
- Subscribe
- Mute
- Subscribe to RSS Feed
- Permalink
- Report Inappropriate Content
Aligning Alternate State trend lines in Line chart
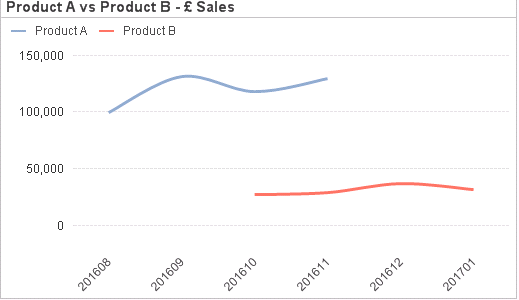
I have two alternate states showing two different products.
The end user wants to select a date range for product A and a date range for product B.
The date range chosen is different for each alternate state BUT the user wants it to appear running parallel with each other. So in the image below, they would like Product B to start at the same position as Product A regardless of the date chosen. (I know this obviously undermines the value of having a date dimension field).
The only way I can think of doing this is to manipulate the date dimension and create a numerical month (e.g. month1, month 2, month 3 etc) to compare the two. This would then enable the comparative trend lines to appear together. Is this possible ?
Is there a better way of doing this ?
- Mark as New
- Bookmark
- Subscribe
- Mute
- Subscribe to RSS Feed
- Permalink
- Report Inappropriate Content
Hi Neil,
maybe in time dimension :
if(product = 'A',Month,Month - x)
with x=2 your curves are aligned
regards
- Mark as New
- Bookmark
- Subscribe
- Mute
- Subscribe to RSS Feed
- Permalink
- Report Inappropriate Content
I guess what dimension would you want to show? I mean will both the lines in the above screenshot show between 201610 to 201701 or 201608 to 201611? or you don't care what they show?