Unlock a world of possibilities! Login now and discover the exclusive benefits awaiting you.
- Qlik Community
- :
- All Forums
- :
- QlikView App Dev
- :
- Re: Alternate States
- Subscribe to RSS Feed
- Mark Topic as New
- Mark Topic as Read
- Float this Topic for Current User
- Bookmark
- Subscribe
- Mute
- Printer Friendly Page
- Mark as New
- Bookmark
- Subscribe
- Mute
- Subscribe to RSS Feed
- Permalink
- Report Inappropriate Content
Alternate States
Hi all,
i am facing an issue with the Alternate states.
In the preview of the image three list boxes are there
1) Year
2)Month &
3)Month
Two charts
Bar chart for the sales region wise.
coming to the requirement for 1 month list box i have given StateA,and for that related barchart also stated as StateA,the other month is StateB and related barchart is stateB.
Now in year list box i have mention the default state .
As per thing by selecting the year the both states A,B has to show the variation ,But it is not showing.
Can any one plz help me in this.
Thanks in Advance.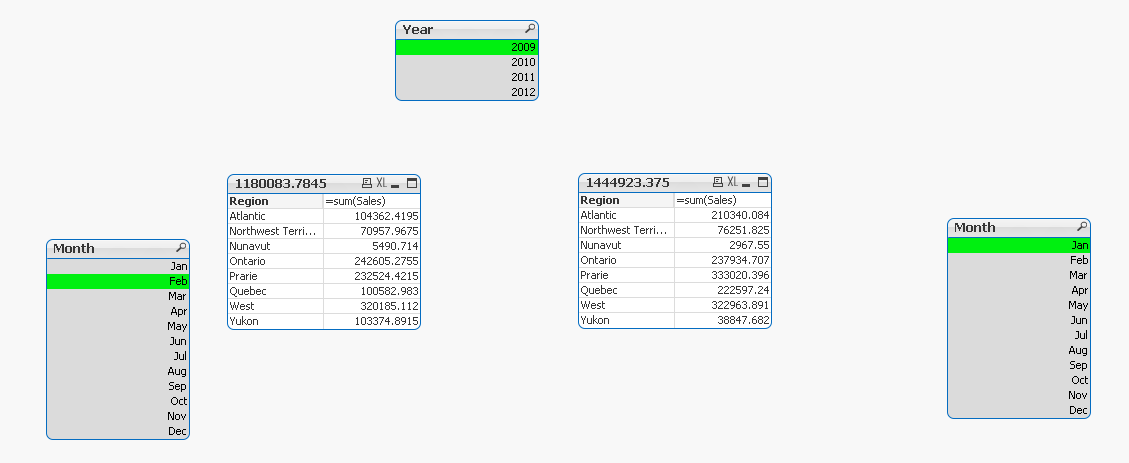
- Mark as New
- Bookmark
- Subscribe
- Mute
- Subscribe to RSS Feed
- Permalink
- Report Inappropriate Content
Can you attach your qvw?
- Mark as New
- Bookmark
- Subscribe
- Mute
- Subscribe to RSS Feed
- Permalink
- Report Inappropriate Content
Try to use use SetAnalysis:
sum({StateA} <Year=$::Year> Sales) for the first chart
sum({StateB} <Year=$::Year> Sales) for the second chart
If a post helps to resolve your issue, please accept it as a Solution.