Unlock a world of possibilities! Login now and discover the exclusive benefits awaiting you.
- Qlik Community
- :
- All Forums
- :
- QlikView App Dev
- :
- Re: Average to show on Totals ONLY?
- Subscribe to RSS Feed
- Mark Topic as New
- Mark Topic as Read
- Float this Topic for Current User
- Bookmark
- Subscribe
- Mute
- Printer Friendly Page
- Mark as New
- Bookmark
- Subscribe
- Mute
- Subscribe to RSS Feed
- Permalink
- Report Inappropriate Content
Average to show on Totals ONLY?
Hello,
I've been searching the forums for an answer to my issue but I haven't been able to find a definite answer whether this is possible or not. So here it goes, on a Pivot Table, is it possible to show the Average 'ONLY' for the total column? My pivot has the Year, and Year Months across (showing the Average by month is irrelevant and the Average only becomes relevant at the Total level). Is this possible?
Thanks,
Hugo
- Tags:
- new_to_qlikview
- Mark as New
- Bookmark
- Subscribe
- Mute
- Subscribe to RSS Feed
- Permalink
- Report Inappropriate Content
This can be done.
First add an expression to your chart: Dimensionality()
Render the chart, look for the dimensionality of the totals line. Make note of this (probably 1 or 0).
Now for your expressions, break them out like this:
if(Dimensionality()>1,Avg(Sales),Sum(Sales))
Or something similar to this. Don't panic if the Dimensionality() expression blows up the chart, it'll go back to normal after you get your calculation right and remove this expression (it was only there so you could see the dimensionality of that totals line).
Use this sparingly though, it'll increase rendering time for large data charts.
- Mark as New
- Bookmark
- Subscribe
- Mute
- Subscribe to RSS Feed
- Permalink
- Report Inappropriate Content
 Hi Steve,
thank you for your input. I am not familiar with 'Dimensionality' and I am not sure if I understood correctly.
I have is a Pivot Table and what I add the dimensionality expression it shows 2 across all the lines even for the totals. Of course this numbers increases or decreases based on the number of dimensions on my pivot table, the user can choose as many or as little dimensions they want to see. The pivot always shows you Year, and MonthYear details. Ideally I want to show "Average" only for the Year Totals and not the monthly details.
- Mark as New
- Bookmark
- Subscribe
- Mute
- Subscribe to RSS Feed
- Permalink
- Report Inappropriate Content
In a pivot table you may also need to leverage secondarydimensionality()
Its a very similar function for use in pivot tables only.
- Mark as New
- Bookmark
- Subscribe
- Mute
- Subscribe to RSS Feed
- Permalink
- Report Inappropriate Content
Yes, I always try Dimensionality() first. If that doesn't work, SecondoaryDimensionality() is my next step.
- Mark as New
- Bookmark
- Subscribe
- Mute
- Subscribe to RSS Feed
- Permalink
- Report Inappropriate Content
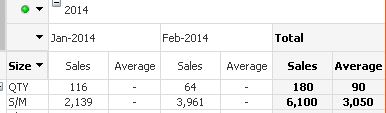
Thank you both Steve and Jonathan, I got the formula to calculate 'only' for Totals, but the column still shows on the month details although with no value. I tried to hide this column using dimensionality but it doesn't seem to work. Do you think is possible or this is as good as it gets?
- Mark as New
- Bookmark
- Subscribe
- Mute
- Subscribe to RSS Feed
- Permalink
- Report Inappropriate Content
To the best of my knowledge, the best way to do this would be to use an additional top-level dimension.
It would be a calculated dimension with the value =' ' and a label of Average
using a similar dimensionality expression (maybe even the same one since you're adding this dimension to the top) this should get you this additional total metric added to your report.
I've used this technique in the past with great success. Here's a link to the resource I used when figuring this out the first time:
http://dvtrenches.wordpress.com/2011/05/11/qlikview-subtotaling-customization-part-2/
- Mark as New
- Bookmark
- Subscribe
- Mute
- Subscribe to RSS Feed
- Permalink
- Report Inappropriate Content
To the best of my knowledge, the best way to do this would be to use an additional top-level dimension.
It would be a calculated dimension with the value =' ' and a label of Average
using a similar dimensionality expression (maybe even the same one since you're adding this dimension to the top) this should get you this additional total metric added to your report.
I've used this technique in the past with great success.
I replied with a link, but that post is currently being moderated. A google search for the terms:
qlikview subtotaling customization part 2
will get you there. I think it's the second result in the list.
- Mark as New
- Bookmark
- Subscribe
- Mute
- Subscribe to RSS Feed
- Permalink
- Report Inappropriate Content
Not directly but there are a few tricks. There were some decent ones in the following post including both 'low tech' methods o as well as a more comprehensive solution based on data model changes.
- Mark as New
- Bookmark
- Subscribe
- Mute
- Subscribe to RSS Feed
- Permalink
- Report Inappropriate Content
Thank you very much to both of you Jonathan and Steve, you have provided me with lots of good information. I will spend some time understanding both suggestions and I will give it a try.