Unlock a world of possibilities! Login now and discover the exclusive benefits awaiting you.
- Qlik Community
- :
- All Forums
- :
- QlikView App Dev
- :
- BOTTOM ANALYSIS
- Subscribe to RSS Feed
- Mark Topic as New
- Mark Topic as Read
- Float this Topic for Current User
- Bookmark
- Subscribe
- Mute
- Printer Friendly Page
- Mark as New
- Bookmark
- Subscribe
- Mute
- Subscribe to RSS Feed
- Permalink
- Report Inappropriate Content
BOTTOM ANALYSIS
Hello,
I am trying to get the bottom analysis using slider for my items and i'm not able to get it.Please help me out.
You can find the chart in the attachment.
Thanks
Atul
- Tags:
- new_to_qlikview
- Mark as New
- Bookmark
- Subscribe
- Mute
- Subscribe to RSS Feed
- Permalink
- Report Inappropriate Content
Try to order them in "Ascending" mode for the Y-Value and select Higher than vBottom in the graphic properties
- Mark as New
- Bookmark
- Subscribe
- Mute
- Subscribe to RSS Feed
- Permalink
- Report Inappropriate Content
is this you are looking for? see the attachment
- Mark as New
- Bookmark
- Subscribe
- Mute
- Subscribe to RSS Feed
- Permalink
- Report Inappropriate Content
No Sir, I want top 10 bottom items and the data should be played with the slider.But using the dimension limit,i'm not able to get it.
- Mark as New
- Bookmark
- Subscribe
- Mute
- Subscribe to RSS Feed
- Permalink
- Report Inappropriate Content
@jsanchezhWhere do i get the graphic properties???
- Mark as New
- Bookmark
- Subscribe
- Mute
- Subscribe to RSS Feed
- Permalink
- Report Inappropriate Content
Hi Atul,
it is working based on the slider selection only.
you just need to do
1. Sort your bar graph Y value Ascending
2. Remove Dimension Limit - Limit restriction
3. Enable chart scrolling - with your variable (vBottom)...
see the screen shot of of bottom 5 below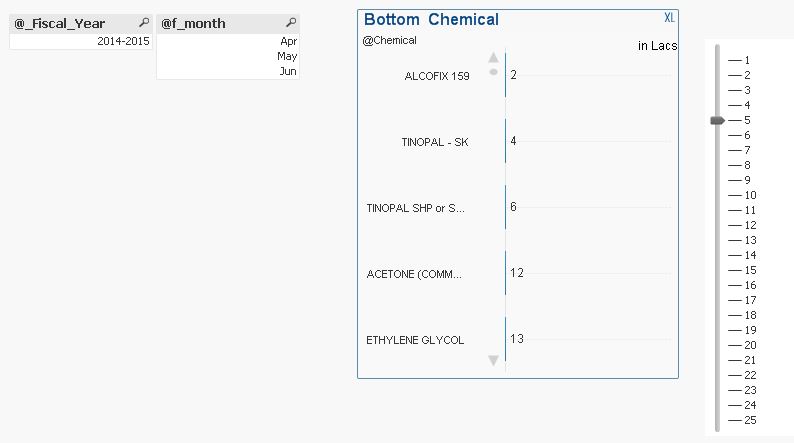
- Mark as New
- Bookmark
- Subscribe
- Mute
- Subscribe to RSS Feed
- Permalink
- Report Inappropriate Content
Dear Sir,
I just need Bottom 10 analysis with dimension limits.
- Mark as New
- Bookmark
- Subscribe
- Mute
- Subscribe to RSS Feed
- Permalink
- Report Inappropriate Content
Hi Atul,
it depends on Null Values.
Try Calculated Dimension instead of @Chemical
=Aggr(If(Not IsNull(#AGEINGQTY), @Chemical),@Chemical)
Regards,
Antonio