Unlock a world of possibilities! Login now and discover the exclusive benefits awaiting you.
- Qlik Community
- :
- All Forums
- :
- QlikView App Dev
- :
- Re: Band/Scenarios - Creating unique keys
- Subscribe to RSS Feed
- Mark Topic as New
- Mark Topic as Read
- Float this Topic for Current User
- Bookmark
- Subscribe
- Mute
- Printer Friendly Page
- Mark as New
- Bookmark
- Subscribe
- Mute
- Subscribe to RSS Feed
- Permalink
- Report Inappropriate Content
Band/Scenarios - Creating unique keys
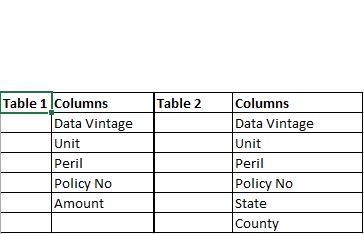
I got two tables - Table 1 and Table 2 with columns listed below.
I got this result set from Table 1.
How do I create the below table result set from table 1, 2 and above table?
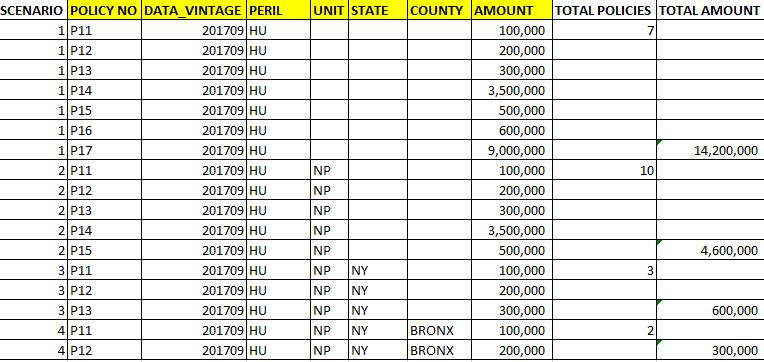
How do I create a band and scenario with below result set ?
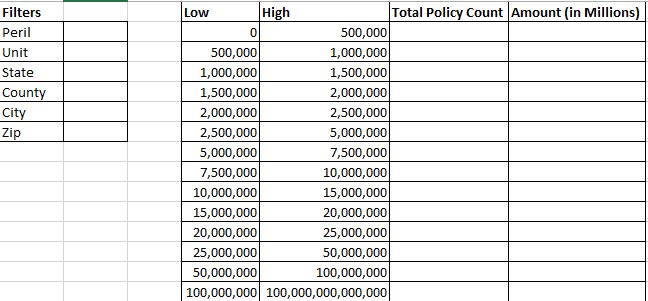
Filters used in the report are all columns from Table 2 except Account No.
I don't need to display Account No in the UI but display the Amount column from Table 1 by aggregating Account No that falls in each band (low band and high band).
Now, how do I create a key or ID (scenarios) with bands and each filter selection so that when an user selection is made, the Amount column reflects data for each applicable filters (as seen in Table 2 columns - except Account No )?
Account No can't be used as a unique Key as same account no can exist in different Perils as well as in different Date Quarters.
- Mark as New
- Bookmark
- Subscribe
- Mute
- Subscribe to RSS Feed
- Permalink
- Report Inappropriate Content
The Table 1 and Table 2 that you have shared above are your raw data or is this processed data? I am not entirely sure I understand what exactly you are trying to do... but I am willing to work with you
- Mark as New
- Bookmark
- Subscribe
- Mute
- Subscribe to RSS Feed
- Permalink
- Report Inappropriate Content
Hi Sunny,
Let me try to explain in a better way.
I have the first table with columns - Data Vintage, Unit, Peril, Policy No, Amount &
second table with columns - Data Vintage, Unit, Peril, Policy No, State, County (I got few other fields such as City, Zip, etc in my requirement but excluded them here to make it less complex).
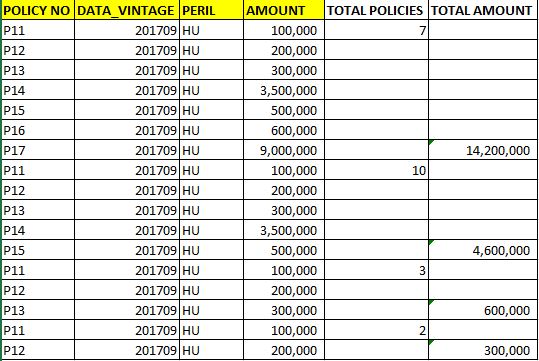
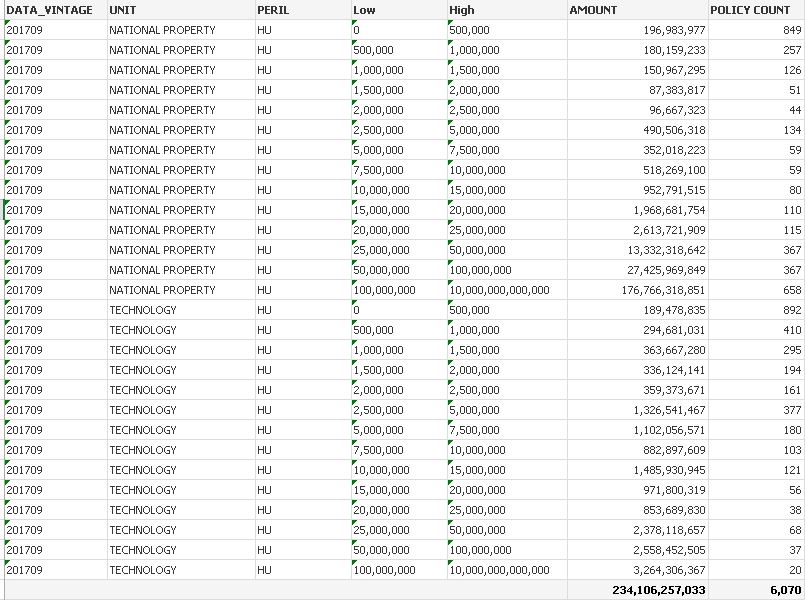
Here's a better example. In this table, I got only one Peril value with multiple Units.
Data Vintage, Unit, Peril are straight column pull from database. Low and High are columns created from an inline table and linked to the Amount for each policy. AMOUNT column in the below table is an expression - 'sum(Amount)' and policy count is distinct count of policies.
Now, am trying to link this result set to my original Table 2 with fields - Data Vintage, Unit, Peril, Policy No, State, County (City, Zip are excluded here for less complication).
Please note that same policy can exist in multiple data vintages and Perils.
Hope this is more clear; or I can answer any questions you may have to help you understand the requirement.
- Mark as New
- Bookmark
- Subscribe
- Mute
- Subscribe to RSS Feed
- Permalink
- Report Inappropriate Content
Again, the two tables you have been talking about? are these front end charts or are they tables from database? What exactly are you looking to do? Is that a front end thing or back end thing? What have you already tried thus far? can you share a sample app or sample data and explain what you have tried? What went wrong with what you tried and what is the expected output? 
- Mark as New
- Bookmark
- Subscribe
- Mute
- Subscribe to RSS Feed
- Permalink
- Report Inappropriate Content
Hi Sunny,
Please find the attached QVWs and the excel source data file for these QVWs. I need to link these two QVWs to get the below output.
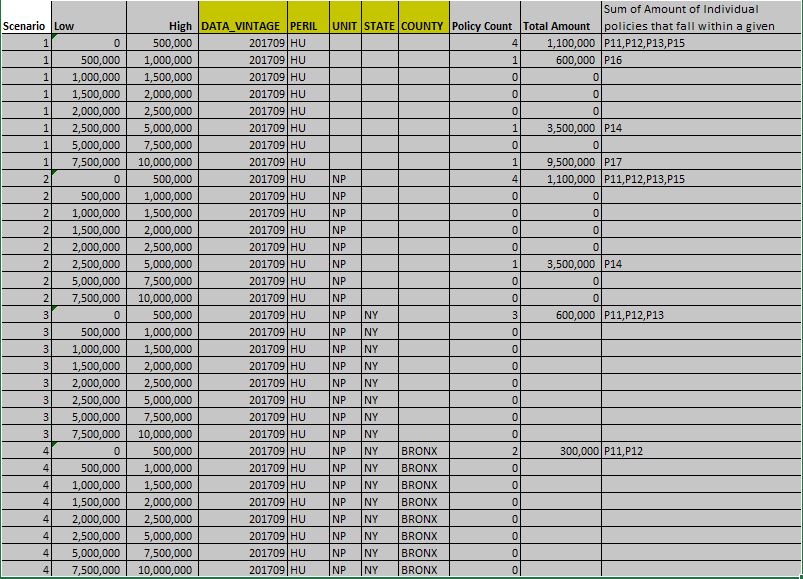
Below is the final output am looking for where the Total Policy Count and Amount changes based on the filter selection. Amount(in Millions) column is the sum of Amount column which should include all the policies with Amount that falls in between Low and High Band.