Unlock a world of possibilities! Login now and discover the exclusive benefits awaiting you.
- Qlik Community
- :
- All Forums
- :
- QlikView App Dev
- :
- Bar Chart Accumulative Stack
- Subscribe to RSS Feed
- Mark Topic as New
- Mark Topic as Read
- Float this Topic for Current User
- Bookmark
- Subscribe
- Mute
- Printer Friendly Page
- Mark as New
- Bookmark
- Subscribe
- Mute
- Subscribe to RSS Feed
- Permalink
- Report Inappropriate Content
Bar Chart Accumulative Stack
Hi Expert,
I have a data like following:
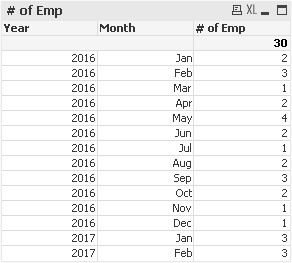
The last data in the example is Feb-2017.
I want to create a Bar Chart with the expected result is like:
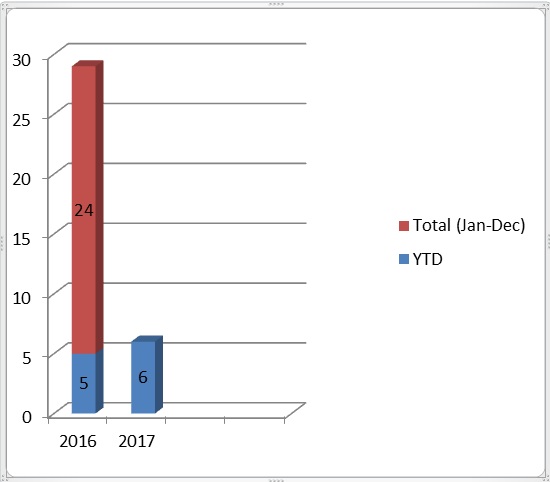
6 = Total Emp accum. to Feb in 2017
5 = Total Emp accum. to Feb in 2016
24 = Total Emp accum. from Jan to Dec in 2016
Can anyone help me the best practice to get the result?
Many thanks.
Accepted Solutions
- Mark as New
- Bookmark
- Subscribe
- Mute
- Subscribe to RSS Feed
- Permalink
- Report Inappropriate Content
Hi Denny,
Dimension : Year
Expression ;
Sum({<Month={'>=1<=$(=Max({<Year={'$(=Max(Year))'}>} Month))'}>} NrEmp)
Sum({<Month=,Year={'$(=Max(Year)-1)'}>} NrEmp)
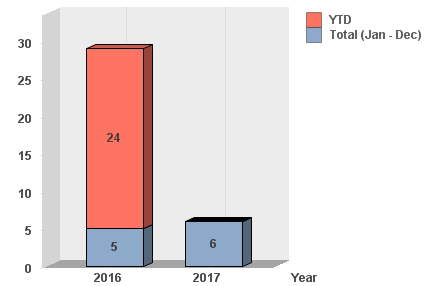
See Attachment.
Regards,
Antonio
- Mark as New
- Bookmark
- Subscribe
- Mute
- Subscribe to RSS Feed
- Permalink
- Report Inappropriate Content
Hi,
May be like in attached file
Regards,
Andrey
- Mark as New
- Bookmark
- Subscribe
- Mute
- Subscribe to RSS Feed
- Permalink
- Report Inappropriate Content
Hi Andrey,
Thank you for your response.
How to make it dynamic? For example if my last data is Mar, so the set analysis should be Sum ({<Month={'Jan', 'Feb','Mar'}>}[# of Emp]). If my last data is Apr, it should be Sum ({<Month={'Jan', 'Feb', 'Mar','Apr'}>}[# of Emp]). etc...
- Mark as New
- Bookmark
- Subscribe
- Mute
- Subscribe to RSS Feed
- Permalink
- Report Inappropriate Content
Hi Denny,
Dimension : Year
Expression ;
Sum({<Month={'>=1<=$(=Max({<Year={'$(=Max(Year))'}>} Month))'}>} NrEmp)
Sum({<Month=,Year={'$(=Max(Year)-1)'}>} NrEmp)
See Attachment.
Regards,
Antonio
- Mark as New
- Bookmark
- Subscribe
- Mute
- Subscribe to RSS Feed
- Permalink
- Report Inappropriate Content
Thank you Antonio. Looks good 