Unlock a world of possibilities! Login now and discover the exclusive benefits awaiting you.
- Qlik Community
- :
- All Forums
- :
- QlikView App Dev
- :
- Bar Chart with gap and text
- Subscribe to RSS Feed
- Mark Topic as New
- Mark Topic as Read
- Float this Topic for Current User
- Bookmark
- Subscribe
- Mute
- Printer Friendly Page
- Mark as New
- Bookmark
- Subscribe
- Mute
- Subscribe to RSS Feed
- Permalink
- Report Inappropriate Content
Bar Chart with gap and text
Hi all,
I have a table like
| Type | % | Points |
| A Batting | 95 | 0.9 |
| A Bowling | 86 | 0.6 |
| B Batting | 97 | 0.7 |
| B Bowling | 84 | 0.5 |
| C Batting | 101 | 1.1 |
| C Bowling | 94 | 0.9 |
And i want to create a bar chart like this
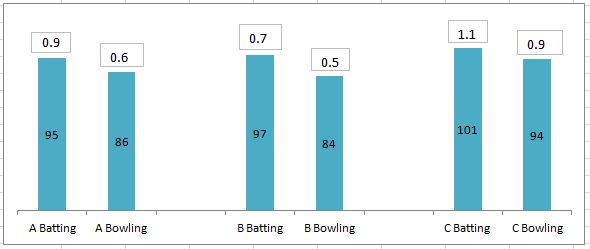
which should have
1. Space between the various groups A,B and C.
2. Points to indicate on the top of bars and % values in the data points.
Can you please help me with this.
Thanks in advance.
Regards,
Kuldeep
- Tags:
- new_to_qlikview
- « Previous Replies
-
- 1
- 2
- Next Replies »
Accepted Solutions
- Mark as New
- Bookmark
- Subscribe
- Mute
- Subscribe to RSS Feed
- Permalink
- Report Inappropriate Content
Like this?
- Mark as New
- Bookmark
- Subscribe
- Mute
- Subscribe to RSS Feed
- Permalink
- Report Inappropriate Content
In your load scripts split :
Type Values like A Batting
Into 2 dimensions :
Team Values like A
Play Values like Batting
And have a Bar Chart with 2 Dimensions Grouped.
- Mark as New
- Bookmark
- Subscribe
- Mute
- Subscribe to RSS Feed
- Permalink
- Report Inappropriate Content
try to duplicate the expression and untick to show as bar, then only the value should be displayed
- Mark as New
- Bookmark
- Subscribe
- Mute
- Subscribe to RSS Feed
- Permalink
- Report Inappropriate Content
There is no direct way you can show one value inside chart and other value on the top of the bar but we can use tricks and can achieve the same using two different bar chart...
Please check enclosed file..
- Mark as New
- Bookmark
- Subscribe
- Mute
- Subscribe to RSS Feed
- Permalink
- Report Inappropriate Content
Hi @kuldeep
i have tried this in my view
just check the attachment
- Mark as New
- Bookmark
- Subscribe
- Mute
- Subscribe to RSS Feed
- Permalink
- Report Inappropriate Content
Thanks Bill and Rudolf for your valuable answers 
- Mark as New
- Bookmark
- Subscribe
- Mute
- Subscribe to RSS Feed
- Permalink
- Report Inappropriate Content
Hey Manish,
Thanks so much. Its very close to what i want.
The only thing is when i try to make the chart from vertical to horizontal orientation, the values moves from the original position.
I wanted to show this with horizontal orientation on style tab.
Regards,
Kuldeep
- Mark as New
- Bookmark
- Subscribe
- Mute
- Subscribe to RSS Feed
- Permalink
- Report Inappropriate Content
Like this?
- Mark as New
- Bookmark
- Subscribe
- Mute
- Subscribe to RSS Feed
- Permalink
- Report Inappropriate Content
This is Perfect!
- Mark as New
- Bookmark
- Subscribe
- Mute
- Subscribe to RSS Feed
- Permalink
- Report Inappropriate Content
Thank Manish. You are the best!
I can now work my real data to form a chart what i want
Regards,
Kuldeep
- « Previous Replies
-
- 1
- 2
- Next Replies »