Unlock a world of possibilities! Login now and discover the exclusive benefits awaiting you.
- Qlik Community
- :
- All Forums
- :
- QlikView App Dev
- :
- Re: Bar Chart
- Subscribe to RSS Feed
- Mark Topic as New
- Mark Topic as Read
- Float this Topic for Current User
- Bookmark
- Subscribe
- Mute
- Printer Friendly Page
- Mark as New
- Bookmark
- Subscribe
- Mute
- Subscribe to RSS Feed
- Permalink
- Report Inappropriate Content
Bar Chart
Hi Experts,
How can i use "Text color","Text Format","Pie Popout","Bar Offset","Line Style","Show Value"
in Expression tab Inside expression "+"(plus Symbol).
Regards,
Mahesh.
- « Previous Replies
-
- 1
- 2
- Next Replies »
Accepted Solutions
- Mark as New
- Bookmark
- Subscribe
- Mute
- Subscribe to RSS Feed
- Permalink
- Report Inappropriate Content
Hi,
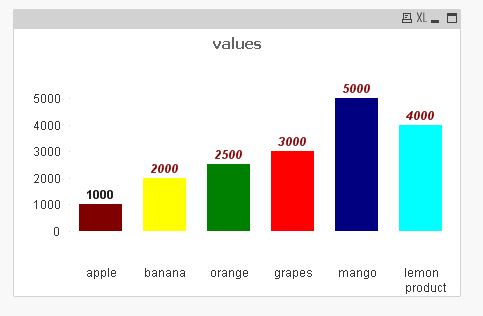
I think you need to enable the 'Value on Data Point' or 'Text on Axis' .
see the below screen shot.
- Mark as New
- Bookmark
- Subscribe
- Mute
- Subscribe to RSS Feed
- Permalink
- Report Inappropriate Content
Hi Mahesh,
Maybe this will help :
| Expression List | The expression list in the top-left pane is a complete tree control with numerous control options. In front of each expression (or expression group) an expansion icon (a box with a ' + ' ) is shown. Clicking the icon opens up underlying sub-expressions or attribute expressions. The icon is simultaneously replaced by a collapse icon ( ' - ' ). Certain plot options utilize sub-expressions, i.e. a set of two or more expressions that together define the plot symbol (e.g. Stock or Box Plot described below). Expression data can also be dynamically formatted by means of attribute expressions. Click on the expansion icon in front of any expression to display the placeholders for the dimension’s attribute expressions. These are:Background Color Edit the default Background Color expression to create the attribute expression for calculating the plot color of the data point. The calculated color will have precedence over the default QlikView color selection and must be a valid color representation, which is achieved by using the Color Functions. If the result of the expression is not a valid color representation, the program will default to black. An auxiliary expression for Text Color can be created using the same method. Text Color An auxiliary expression for Text Color can be created using the same method as for the background color (see above). Text Format Edit the Text Format expression to enter an attribute expression for calculating the font style of text associated with the data point (For tables: text in the table cell for each dimension cell. The calculated text format will have precedence over table style defined in the Chart Properties: Style.) The expression used as text format expression should return a string containing a '<B>' for bold text, '<I>' for italic text and/or '<U>' for underlined text. Note that = is necessary before the string. Pie Popout Click on the Pie Popout in order to enter an attribute expression for calculating whether the pie slice associated with the data point should be drawn in an extracted "popout" position. This type of attribute expression only has effect on pie charts. Bar Offset Click on Bar Offset in order to enter an attribute expression for calculating an offset for the bar or bar segment associated with the data point. The offset can be positive or negative and will move the bar or segment accordingly. This is useful e.g. when making so called waterfall charts. This type of attribute expression only has effect on bar charts. Line Style Click on Line Style in order to enter an attribute expression for calculating the line style for the line or line segment associated with the data point. This type of attribute expression only has effect on line, combo and radar charts. The relative width of the line can be controlled by including a tag <Wn> where n is a multiplying factor to be applied on the default line width of the chart. The number n must be a real number between 0.5 and 8. Example: <W2.5>. The style of the line can be controlled by including a tag <Sn> where n is an integer between 1 and 4 indicating the style to be used (1=continuous, 2= dashed, 3=dotted, 4=dashed/dotted). Example: <S3>. The <Wn> and <Sn> tags can be freely combined, but only the first occurrence of each counts. The tags must be enclosed by single quotations. Show Value Click on Show Value in order to enter an attribute expression for calculating whether the data point plot should be complemented with a "value on data point" value, even if Values on Data Points has not been selected for the main expression. If Values on Data Points is selected for the main expression the attribute expression will be disregarded. This type of attribute expression only has effect on bar, line and combo charts. |
- Mark as New
- Bookmark
- Subscribe
- Mute
- Subscribe to RSS Feed
- Permalink
- Report Inappropriate Content
Hi
Can any body give with example?
Regards,
Mahesh.
- Mark as New
- Bookmark
- Subscribe
- Mute
- Subscribe to RSS Feed
- Permalink
- Report Inappropriate Content
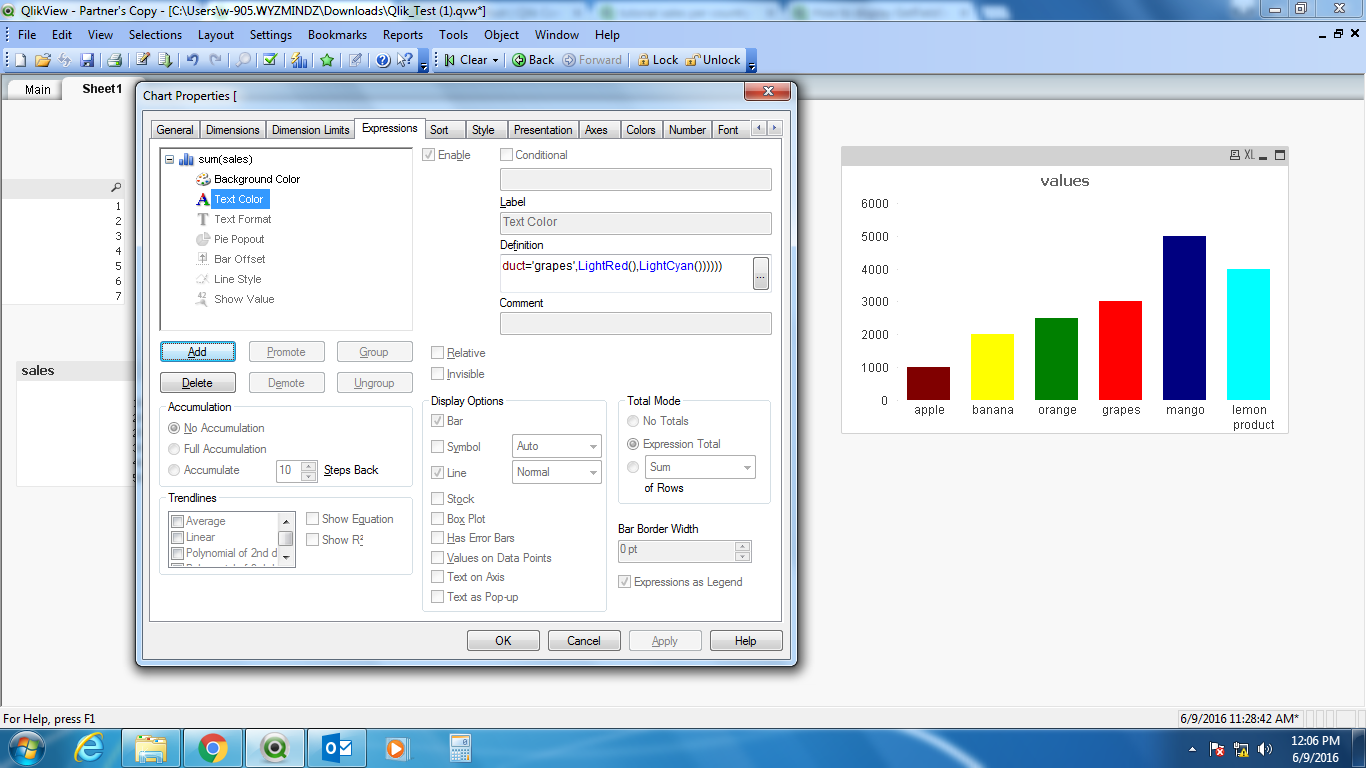
Mahesh,
Font -
RGB(0,128,0) and RGB(128, 0, 0)
Text -
First go to the User Preferences, and choose "Always Show Design Menu Items" in the Design tab.
Then, if you right click on your header, you will have the "Custom Format Cell" entry in the contextual menu.
You will be abble to fine tune the colors of your cells.
Pie Popout -
In that expression, + symbol is there in that go to Pie Popout --> Sum(Sales) > 30
Bar Offset -
Please check your self
- Mark as New
- Bookmark
- Subscribe
- Mute
- Subscribe to RSS Feed
- Permalink
- Report Inappropriate Content
Hi Anil,
please find my attached file. i am not getting any thing ,please check my file.
Regards,
Mahesh.
- Mark as New
- Bookmark
- Subscribe
- Mute
- Subscribe to RSS Feed
- Permalink
- Report Inappropriate Content
Hi Filip,
Thanks for your reply ,i tried like that , I am not getting please check my below attached file.
Regards,
Mahesh.
- Mark as New
- Bookmark
- Subscribe
- Mute
- Subscribe to RSS Feed
- Permalink
- Report Inappropriate Content
Hi,
I think you need to enable the 'Value on Data Point' or 'Text on Axis' .
see the below screen shot.
- Mark as New
- Bookmark
- Subscribe
- Mute
- Subscribe to RSS Feed
- Permalink
- Report Inappropriate Content
Hi Settu,
Correct.
how can i use this options in bar chart :-
"Pie Popout","Line Style","Show Value".
Regards,
Mahesh.
- Mark as New
- Bookmark
- Subscribe
- Mute
- Subscribe to RSS Feed
- Permalink
- Report Inappropriate Content
Hi Mahesh,
It is based on our need. you can just search "Pie Popout", you will get more idea.
for e.g see this for "Pie Popout"
- Mark as New
- Bookmark
- Subscribe
- Mute
- Subscribe to RSS Feed
- Permalink
- Report Inappropriate Content
And this one..
- « Previous Replies
-
- 1
- 2
- Next Replies »