Unlock a world of possibilities! Login now and discover the exclusive benefits awaiting you.
- Qlik Community
- :
- All Forums
- :
- QlikView App Dev
- :
- Bar chart Expression
Options
- Subscribe to RSS Feed
- Mark Topic as New
- Mark Topic as Read
- Float this Topic for Current User
- Bookmark
- Subscribe
- Mute
- Printer Friendly Page
Turn on suggestions
Auto-suggest helps you quickly narrow down your search results by suggesting possible matches as you type.
Showing results for
Anonymous
Not applicable
2017-04-21
10:18 AM
- Mark as New
- Bookmark
- Subscribe
- Mute
- Subscribe to RSS Feed
- Permalink
- Report Inappropriate Content
Bar chart Expression
Guys,
As per my requirement, I have a customer which has two mappings that I need to show as exactly below,
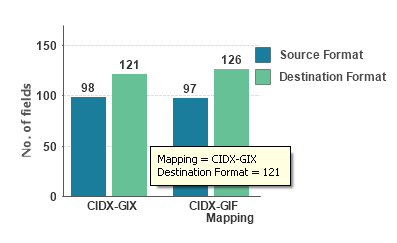
But I have a dimension as customer, which is mapped to two values in the dimension "Mapping". I couldn't achieve this chart, Plz help me how to achieve this or how to load data according to this.
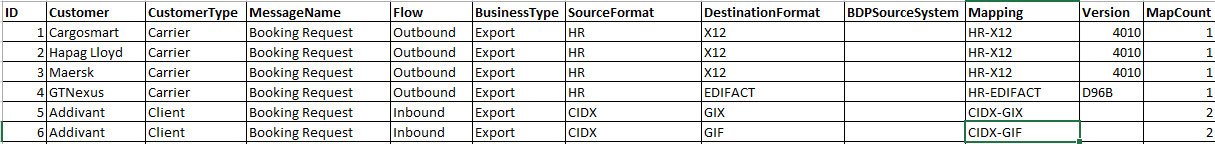
Now I have the data loaded in the below format,
196 Views
1 Reply
Specialist II
2017-04-21
10:48 AM
- Mark as New
- Bookmark
- Subscribe
- Mute
- Subscribe to RSS Feed
- Permalink
- Report Inappropriate Content
Dimension: Mapping
Expression 1: Count({<Mapping = {'CIDX'}>}SourceFormat)
Expression 2: Count({<Mapping = {'GIF', 'GIX'}>}DestinationFormat)
Change the Mapping parameters as per you requirement.
142 Views