Unlock a world of possibilities! Login now and discover the exclusive benefits awaiting you.
- Qlik Community
- :
- All Forums
- :
- QlikView App Dev
- :
- Re: Bar chart creation using particular fields fro...
- Subscribe to RSS Feed
- Mark Topic as New
- Mark Topic as Read
- Float this Topic for Current User
- Bookmark
- Subscribe
- Mute
- Printer Friendly Page
- Mark as New
- Bookmark
- Subscribe
- Mute
- Subscribe to RSS Feed
- Permalink
- Report Inappropriate Content
Bar chart creation using particular fields from 2 dimensions
Hi All,
I am facing a challenge to create a bar chart using 2 dimensions for below data set.
| Manager | Supervisior | PAT Roll No |
| Anindya | ABC | 1 |
| Anindya | ABC | 11 |
| Anindya | ABC | 22 |
| Anindya | ABC | 1 |
| Anindya | ABC | 22 |
| Anindya | ABC | 33 |
| Anindya | DEF | 10 |
| Anindya | DEF | 10 |
| Mehtab | ABC | 33 |
| Mehtab | FED | 44 |
| Sagar | ABC | 22 |
| Sagar | FED | 33 |
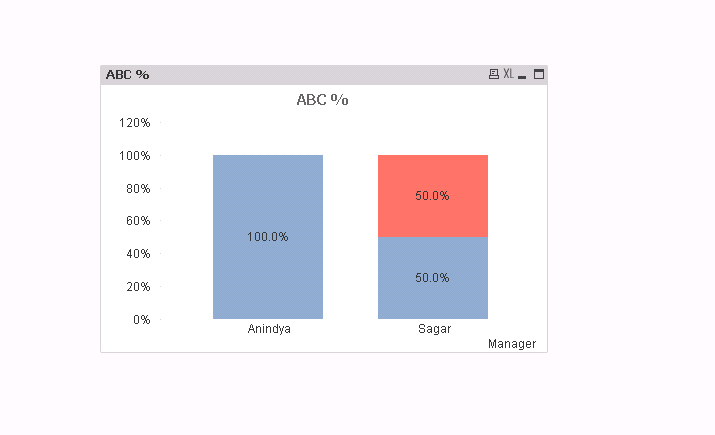
I need to create bar chart only for Anindya and sagar who are under manager and for supervisiors ABC,FED and bar chart should be 'grouped bar chart' and it should show share of count of DISTINCT 'PAT Roll No' under supervisior and manager dimension in respective bars. for example count of PAT roll no in Anindya in ABC and FED is 4(as there is no FED for anindya) so ABC bar chart will show 100%(4/4) and for FED it will be 0%
Then for sagar count of pat roll no under ABC and FED is 2(1+1) so 50% for ABC bar(1/2) and 50% for FED bar(1/2)
Note - need to count distinct PAT roll no under Manager and supervisior combination but PAT Roll no can be duplicate among different combinations
Thanks,
- Mark as New
- Bookmark
- Subscribe
- Mute
- Subscribe to RSS Feed
- Permalink
- Report Inappropriate Content
- Mark as New
- Bookmark
- Subscribe
- Mute
- Subscribe to RSS Feed
- Permalink
- Report Inappropriate Content
- Mark as New
- Bookmark
- Subscribe
- Mute
- Subscribe to RSS Feed
- Permalink
- Report Inappropriate Content
Anindya,
309204:
LOAD * Inline [
Manager, Supervisior, "PAT Roll No"
Anindya, ABC, 1
Anindya, ABC, 11
Anindya, ABC, 22
Anindya, ABC, 1
Anindya, ABC, 22
Anindya, ABC, 33
Anindya, DEF, 10
Anindya, DEF, 10
Mehtab, ABC, 33
Mehtab, FED, 44
Sagar, ABC, 22
Sagar, FED, 33
] (delimiter is ',');
Create a bar chart:
Dimension: =aggr(only({1<Manager={'Anindya','Sagar'}>} Manager),Manager)
create two expressions
ABC%Expression:==count({<Supervisior={'ABC'}>}DISTINCT [PAT Roll No])/count({<Supervisior={'ABC','FED'}>}DISTINCT [PAT Roll No])
FED% Expression: =count(AGGR(count({<Supervisior={'FED'}>}DISTINCT [PAT Roll No]),Manager))/count({<Supervisior={'ABC','FED'}>}DISTINCT [PAT Roll No])
Style : Select Stacked
Presentation: check Plot Values inside segments
Dimensions tab: check suppress null values.