Unlock a world of possibilities! Login now and discover the exclusive benefits awaiting you.
- Qlik Community
- :
- All Forums
- :
- QlikView App Dev
- :
- Bar chart period on a bar chart, and later keep sh...
Options
- Subscribe to RSS Feed
- Mark Topic as New
- Mark Topic as Read
- Float this Topic for Current User
- Bookmark
- Subscribe
- Mute
- Printer Friendly Page
Turn on suggestions
Auto-suggest helps you quickly narrow down your search results by suggesting possible matches as you type.
Showing results for
Anonymous
Not applicable
2017-07-03
05:59 AM
- Mark as New
- Bookmark
- Subscribe
- Mute
- Subscribe to RSS Feed
- Permalink
- Report Inappropriate Content
Bar chart period on a bar chart, and later keep showing months
Hello,
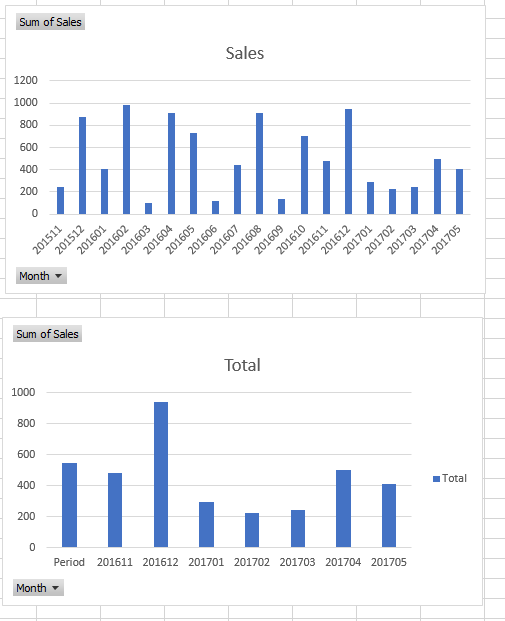
I would like to know it there is a possibility on a graph instead of showing x months, to shorten it, make an average and later keep showing months.
for example on the photo below, i made a period form 201511 to 201610.
thank you
186 Views
1 Solution
Accepted Solutions
MVP
2017-07-03
06:08 AM
- Mark as New
- Bookmark
- Subscribe
- Mute
- Subscribe to RSS Feed
- Permalink
- Report Inappropriate Content
Dimension
=IF(OrderYearMonth < Date#('201611','YYYYMM'), 'Period',Date(OrderYearMonth,'YYYYMM'))
Expression
=IF(OrderYearMonth >= Date#('201611','YYYYMM'), SUM(Sales), Avg(Aggr(SUM(Sales),OrderYearMonth)))
150 Views
1 Reply
MVP
2017-07-03
06:08 AM
- Mark as New
- Bookmark
- Subscribe
- Mute
- Subscribe to RSS Feed
- Permalink
- Report Inappropriate Content
Dimension
=IF(OrderYearMonth < Date#('201611','YYYYMM'), 'Period',Date(OrderYearMonth,'YYYYMM'))
Expression
=IF(OrderYearMonth >= Date#('201611','YYYYMM'), SUM(Sales), Avg(Aggr(SUM(Sales),OrderYearMonth)))
151 Views