Unlock a world of possibilities! Login now and discover the exclusive benefits awaiting you.
- Qlik Community
- :
- All Forums
- :
- QlikView App Dev
- :
- Bar chart totals
- Subscribe to RSS Feed
- Mark Topic as New
- Mark Topic as Read
- Float this Topic for Current User
- Bookmark
- Subscribe
- Mute
- Printer Friendly Page
- Mark as New
- Bookmark
- Subscribe
- Mute
- Subscribe to RSS Feed
- Permalink
- Report Inappropriate Content
Bar chart totals
Gurus,
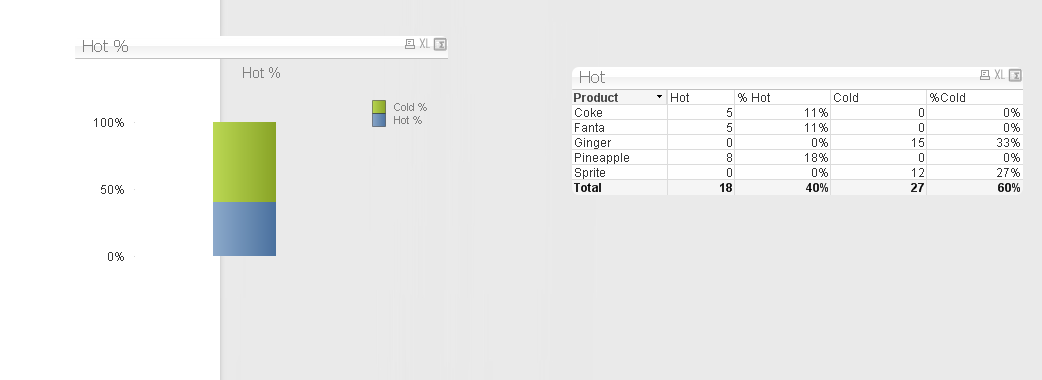
I have worked on my model to point of the attached excel. My next step is to build a chat that will have stacked bars with hot and cold showing the %ntages without minding the product but the whole lot as a total. As in the picture.
- Tags:
- new_to_qlikview
Accepted Solutions
- Mark as New
- Bookmark
- Subscribe
- Mute
- Subscribe to RSS Feed
- Permalink
- Report Inappropriate Content
Here is an example. Note that your data had a 'total' row so to remove that from the load i used a WHERE filter in the script to not load that row.
Attached QVW is the full solution. Screenshot shows the numbers as you want and the breakdown.
LOAD Product,
Hot,
Cold
FROM
(ooxml, embedded labels, table is Sheet1)
where Product <> 'Total';
- Mark as New
- Bookmark
- Subscribe
- Mute
- Subscribe to RSS Feed
- Permalink
- Report Inappropriate Content
Thanks for sharing your story. Good luck with the next step. Perhaps this documents helps: QlikCommunity Tip: How to get answers to your post?
talk is cheap, supply exceeds demand
- Mark as New
- Bookmark
- Subscribe
- Mute
- Subscribe to RSS Feed
- Permalink
- Report Inappropriate Content
Explain properly please also with sample load script and short data that help more to the others to help. In attached excel Product is only field or you have other also.
Let me know please
| Product | Hot | Cold |
| Coke | 5 | |
| Fanta | 5 | |
| Sprite | 12 | |
| Ginger | 15 | |
| Pineapple | 8 | |
| Total | 18 | 27 |
Regards,
Anand
- Mark as New
- Bookmark
- Subscribe
- Mute
- Subscribe to RSS Feed
- Permalink
- Report Inappropriate Content
Here is an example. Note that your data had a 'total' row so to remove that from the load i used a WHERE filter in the script to not load that row.
Attached QVW is the full solution. Screenshot shows the numbers as you want and the breakdown.
LOAD Product,
Hot,
Cold
FROM
(ooxml, embedded labels, table is Sheet1)
where Product <> 'Total';
- Mark as New
- Bookmark
- Subscribe
- Mute
- Subscribe to RSS Feed
- Permalink
- Report Inappropriate Content
Thanks Jonathan this helps.