Unlock a world of possibilities! Login now and discover the exclusive benefits awaiting you.
- Qlik Community
- :
- All Forums
- :
- QlikView App Dev
- :
- Bars on chart do not line up
- Subscribe to RSS Feed
- Mark Topic as New
- Mark Topic as Read
- Float this Topic for Current User
- Bookmark
- Subscribe
- Mute
- Printer Friendly Page
- Mark as New
- Bookmark
- Subscribe
- Mute
- Subscribe to RSS Feed
- Permalink
- Report Inappropriate Content
Bars on chart do not line up
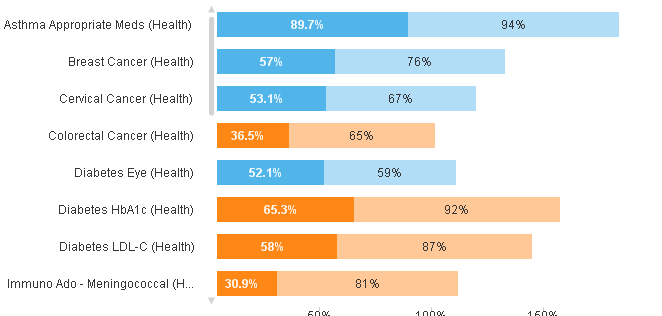
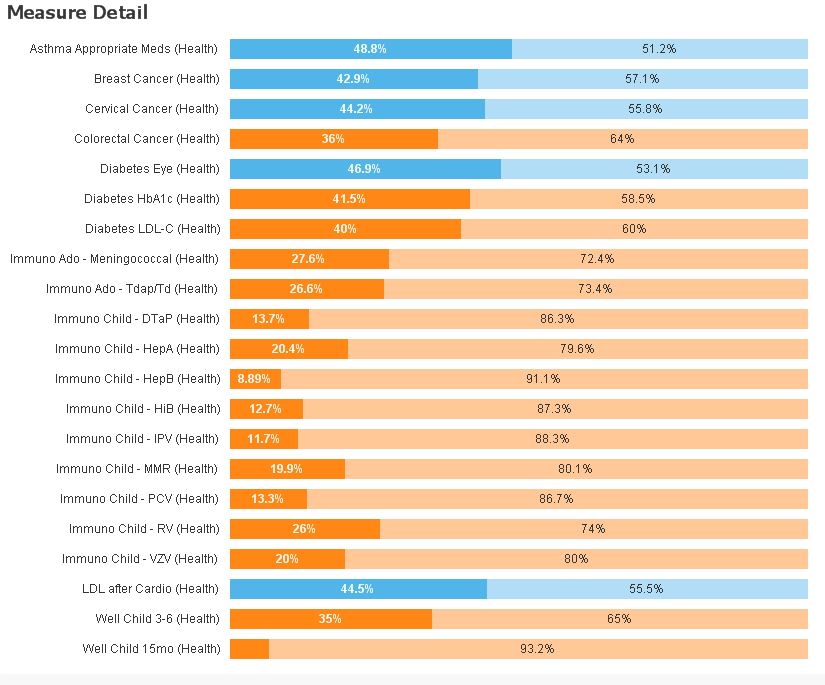
I have a stacked bar chart and not all of the bars are the same length.
I am new to QV and have no idea what might be causing this or if there is a setting that I need to change. They should all be the same length. I don't think that I am doing anything advanced in this chart. Just one dimension and two expressions that are stacked.
- Tags:
- new_to_qlikview
- Mark as New
- Bookmark
- Subscribe
- Mute
- Subscribe to RSS Feed
- Permalink
- Report Inappropriate Content
would you mind sharing a sample of your qvw?
- Mark as New
- Bookmark
- Subscribe
- Mute
- Subscribe to RSS Feed
- Permalink
- Report Inappropriate Content
Here is the file
- Mark as New
- Bookmark
- Subscribe
- Mute
- Subscribe to RSS Feed
- Permalink
- Report Inappropriate Content
Downloadind and checking
"Measure Detail" bar char?
- Mark as New
- Bookmark
- Subscribe
- Mute
- Subscribe to RSS Feed
- Permalink
- Report Inappropriate Content
I think it´s your bar graph, right? I am noticing that you have different values, you want them always suming 100%? I´m afraid I can´t see the whole picture what you really need
- Mark as New
- Bookmark
- Subscribe
- Mute
- Subscribe to RSS Feed
- Permalink
- Report Inappropriate Content
yes
- Mark as New
- Bookmark
- Subscribe
- Mute
- Subscribe to RSS Feed
- Permalink
- Report Inappropriate Content
You can hold down control while you click the chart and a red square will appear, you can adjust the way the chart sizes to your liking.
- Mark as New
- Bookmark
- Subscribe
- Mute
- Subscribe to RSS Feed
- Permalink
- Report Inappropriate Content
Hi,
your two expressions do not sum up to the same values, so the bars can't line up per se:
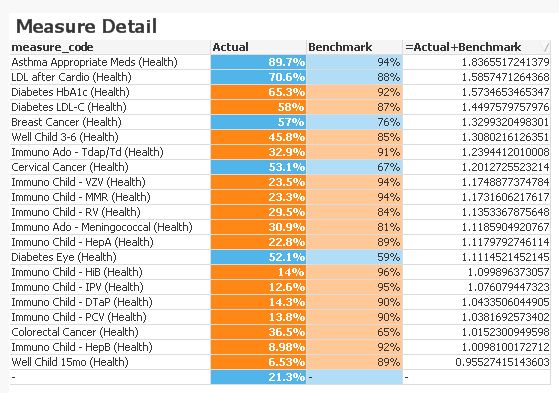
As you are the expert for your data, you are the one to tell what's "wrong" with your data or calculations.
However, if you just want to graphically align the bars, even if they represent different values (as they are scaled in % it might be a relative comparison anyway), you could do so like this:
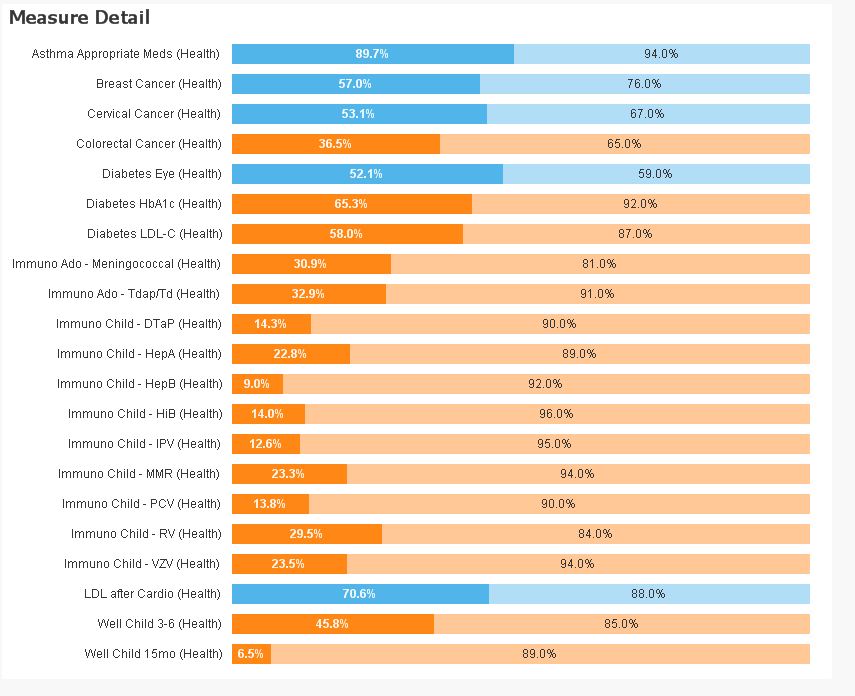
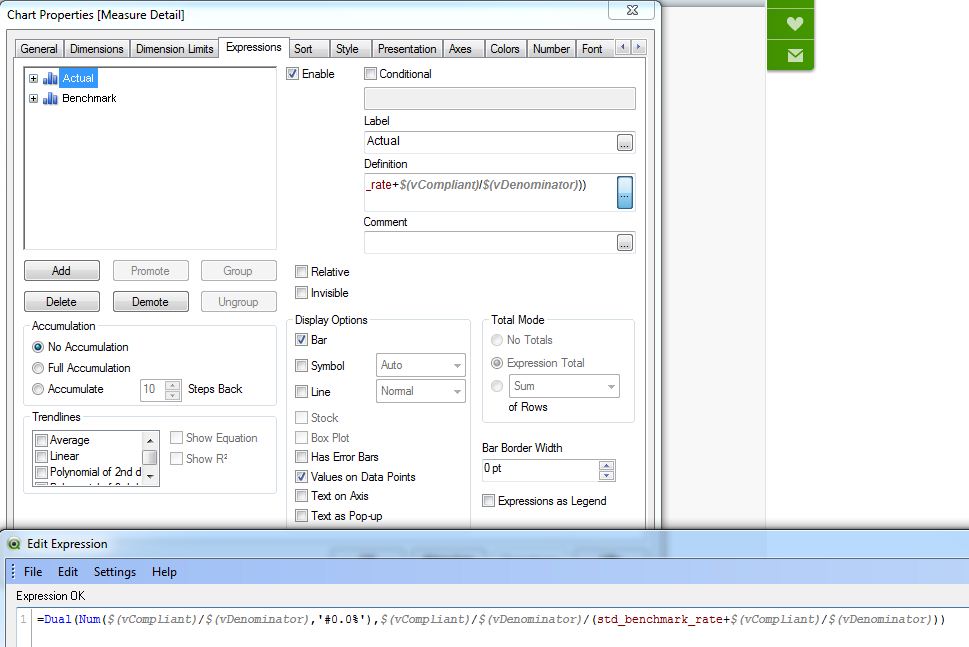
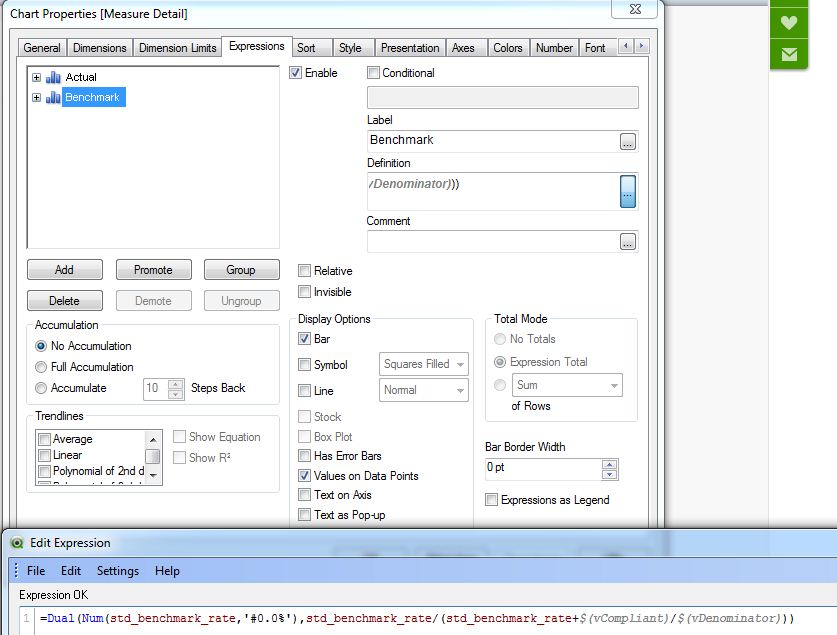
Or just showing the bars relative with the numerical part of the above mentioned dual() functions:
hope this helps
regards
Marco
- Mark as New
- Bookmark
- Subscribe
- Mute
- Subscribe to RSS Feed
- Permalink
- Report Inappropriate Content
The two bars should not add up to say 100%. They are two different calculations just being displayed for the same measure. So I don't understand why one bar would be treated differently than the rest of them.