Unlock a world of possibilities! Login now and discover the exclusive benefits awaiting you.
- Qlik Community
- :
- All Forums
- :
- QlikView App Dev
- :
- Re: Best way to configure load statement for Pie C...
- Subscribe to RSS Feed
- Mark Topic as New
- Mark Topic as Read
- Float this Topic for Current User
- Bookmark
- Subscribe
- Mute
- Printer Friendly Page
- Mark as New
- Bookmark
- Subscribe
- Mute
- Subscribe to RSS Feed
- Permalink
- Report Inappropriate Content
Best way to configure load statement for Pie Chart
| Country | Month | Sales1 | Sales2 | Sales3 |
|---|---|---|---|---|
| United Kingdom | Jan | 5000 | 6000 | 4500 |
| United Kingdom | Feb | 4300 | 3000 | 4000 |
| United Kingdom | Mar | 6000 | 4500 | 4500 |
| United Kingdom | Apr | 2900 | 7000 | 5000 |
| France | Jan | 4000 | 4000 | 3000 |
| France | Feb | 4000 | 2000 | 3100 |
| France | Mar | 4500 | 1500 | 3500 |
| France | Apr | 3000 | 5500 | 3700 |
Hi All,
i am after some advice on the best way to do a load statement for the above - this is in an excel file.
I am currently importing this OK, and use Country and Month as filters, however, my current load statement works for my qlikview file, but is not quite right to get a pie chart with percentages.
So, i'll have United Kingdom selected for a filter, and Jan for example, what i'd like the pie chart to then show is Sales1, Sales2 and Sales 3 as a percentage of the total for those 3 categories.
And for that to obviously change dependant on the country or the month that i select.
I cannot figure how best to do a new load statement to handle this, so any advice is much appreciated.
Regards
Jason
Accepted Solutions
- Mark as New
- Bookmark
- Subscribe
- Mute
- Subscribe to RSS Feed
- Permalink
- Report Inappropriate Content
You need to do a crosstable load
Crosstable (Saletype, Saleavalue,2)
Load
Country,
Month,
Sale1,Sale2, Sale3
From xxxx;
Now for pie chart use Saletype as dimension and sum (salevalue) as expression
If a post helps to resolve your issue, please accept it as a Solution.
- Mark as New
- Bookmark
- Subscribe
- Mute
- Subscribe to RSS Feed
- Permalink
- Report Inappropriate Content
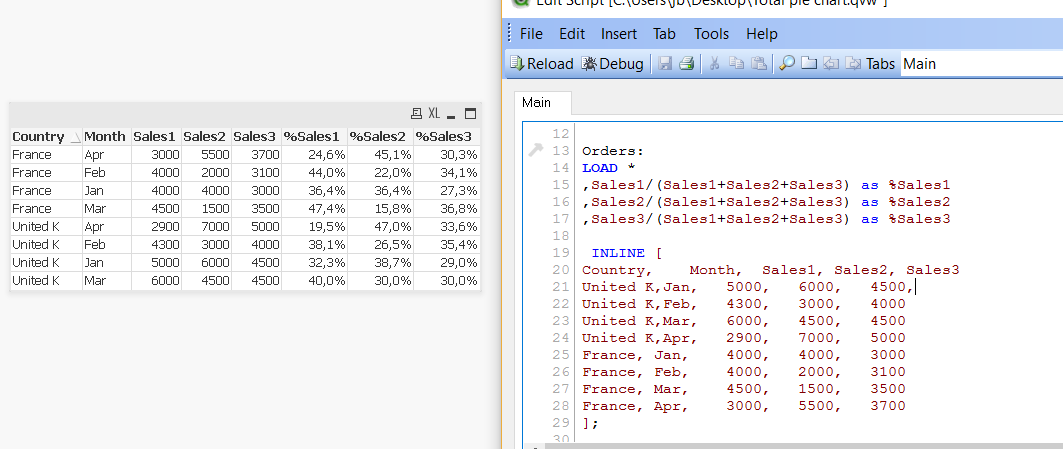
Is it what you are trying to achieve?
- Mark as New
- Bookmark
- Subscribe
- Mute
- Subscribe to RSS Feed
- Permalink
- Report Inappropriate Content
be careful using expressions like Sales1 + Sales2 + Sales3
If only 1 field isnull() you'll get null() as return value!
- Mark as New
- Bookmark
- Subscribe
- Mute
- Subscribe to RSS Feed
- Permalink
- Report Inappropriate Content
You're right, but what is the way to avoid that?
- Mark as New
- Bookmark
- Subscribe
- Mute
- Subscribe to RSS Feed
- Permalink
- Report Inappropriate Content
rangesum(Sales1,Sales2,Sales3) ...
- Mark as New
- Bookmark
- Subscribe
- Mute
- Subscribe to RSS Feed
- Permalink
- Report Inappropriate Content
Hi Jean-Baptiste,
i was hoping not to do this as an 'in-line' as this is just a sample set, and there may be 12 months for each conutry, and loads of countries...
Once i can get the data in there, i was then planning to se it in a pie chart to show percentages and values.
Thanks for all commetns up till now.
Regards
Jason
- Mark as New
- Bookmark
- Subscribe
- Mute
- Subscribe to RSS Feed
- Permalink
- Report Inappropriate Content
You need to do a crosstable load
Crosstable (Saletype, Saleavalue,2)
Load
Country,
Month,
Sale1,Sale2, Sale3
From xxxx;
Now for pie chart use Saletype as dimension and sum (salevalue) as expression
If a post helps to resolve your issue, please accept it as a Solution.
- Mark as New
- Bookmark
- Subscribe
- Mute
- Subscribe to RSS Feed
- Permalink
- Report Inappropriate Content
Read more here
If a post helps to resolve your issue, please accept it as a Solution.
- Mark as New
- Bookmark
- Subscribe
- Mute
- Subscribe to RSS Feed
- Permalink
- Report Inappropriate Content
Hi Vineeth,
perfect, thankyou very much, i always forget about the CrossTable, exactly what was needed, many thanks for the help.
Jason