Unlock a world of possibilities! Login now and discover the exclusive benefits awaiting you.
- Qlik Community
- :
- All Forums
- :
- QlikView App Dev
- :
- Re: Break Line chart
Options
- Subscribe to RSS Feed
- Mark Topic as New
- Mark Topic as Read
- Float this Topic for Current User
- Bookmark
- Subscribe
- Mute
- Printer Friendly Page
Turn on suggestions
Auto-suggest helps you quickly narrow down your search results by suggesting possible matches as you type.
Showing results for
Not applicable
2014-11-26
04:06 AM
- Mark as New
- Bookmark
- Subscribe
- Mute
- Subscribe to RSS Feed
- Permalink
- Report Inappropriate Content
Break Line chart
Hi Folks,
Is there any method in qlikview to break time series line chart on basis of data points.
Like I want my line chart to break if data is not present on some particular data point.
Regards,
Navdeep
1,829 Views
- « Previous Replies
-
- 1
- 2
- Next Replies »
11 Replies
Not applicable
2014-11-26
08:33 AM
Author
- Mark as New
- Bookmark
- Subscribe
- Mute
- Subscribe to RSS Feed
- Permalink
- Report Inappropriate Content
sales1 and Sales2 are two different fields, so using the if bellow ! works even for chaging the color of the line.
482 Views
Employee
2015-08-08
09:47 PM
- Mark as New
- Bookmark
- Subscribe
- Mute
- Subscribe to RSS Feed
- Permalink
- Report Inappropriate Content
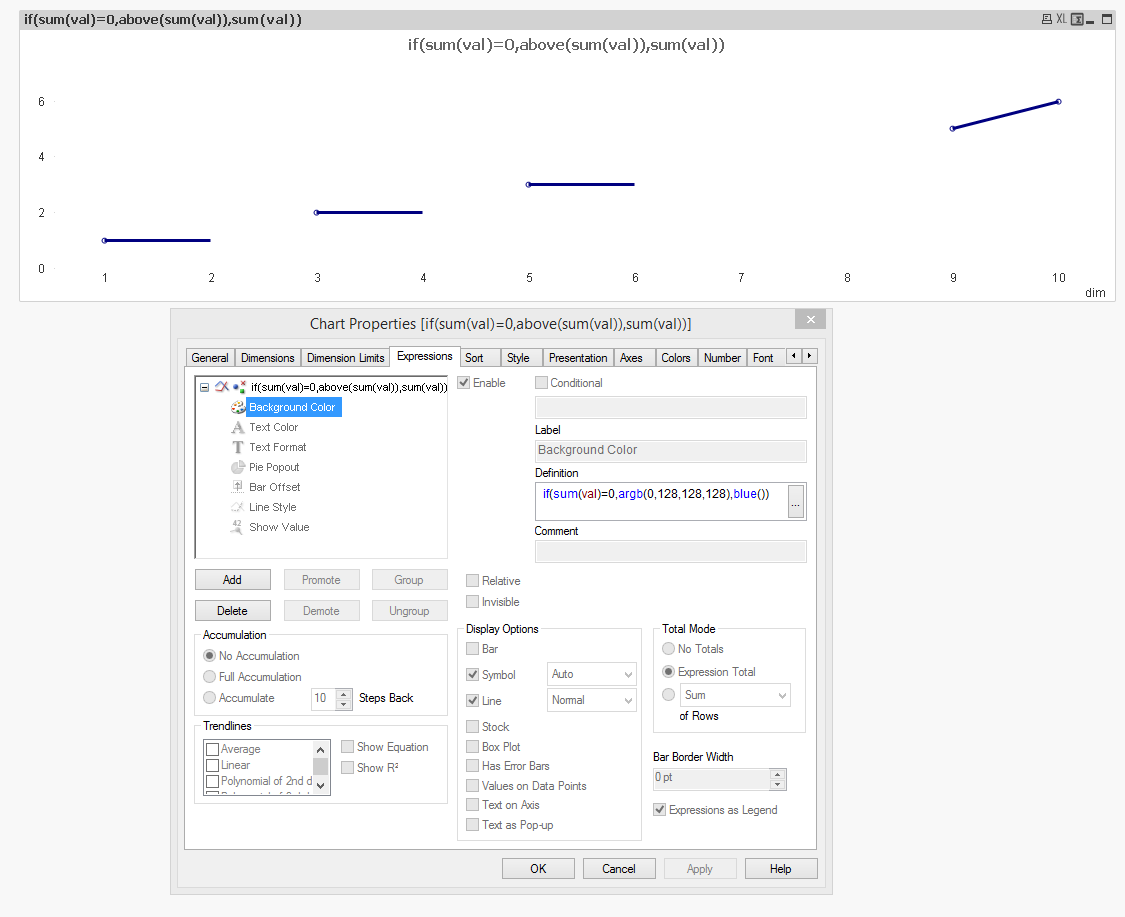
Hey navdeep,
Not quite exactly what you wanted, but it might be pretty close. What I did was
- use the above function on the expression to create a second point after the last one that has a value on the line, so in this case the line doesn't drop to 0
- use the argb() function to color the sections of the line that have value and hide the parts of the line without value
482 Views
- « Previous Replies
-
- 1
- 2
- Next Replies »