Unlock a world of possibilities! Login now and discover the exclusive benefits awaiting you.
- Qlik Community
- :
- All Forums
- :
- QlikView App Dev
- :
- Bring the allocation level in day wise
- Subscribe to RSS Feed
- Mark Topic as New
- Mark Topic as Read
- Float this Topic for Current User
- Bookmark
- Subscribe
- Mute
- Printer Friendly Page
- Mark as New
- Bookmark
- Subscribe
- Mute
- Subscribe to RSS Feed
- Permalink
- Report Inappropriate Content
Bring the allocation level in day wise
Hi All,
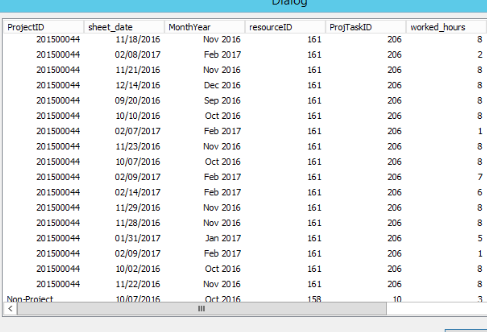
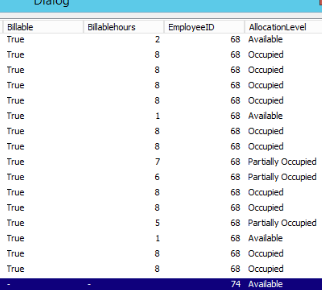
In below image I have a allocation level in date wise so, I need to use Pie chart for allocation level to find count of how many employees are occupied ,Partially occupied and Available , Allocation level as IF( worked_hours>7, 'Occupied', IF( worked_hours>3 and worked_hours<8, 'Partially Occupied', IF( worked_hours<4, 'Available' ))) so What can I give as dimensional and expression in Pie chart to show day wise allocation
- Mark as New
- Bookmark
- Subscribe
- Mute
- Subscribe to RSS Feed
- Permalink
- Report Inappropriate Content
Instead of Pie chart, I would go Funnel chart for this
Dimension as
IF(worked_hours<4, 'Occupied', IF(worked_hours>3 and worked_hours<8, 'Partially Occupied', IF( worked_hours>7, 'Available' )))
Expression what you want to calculate
may be ---- Sum(Measure) or Count(Measure) {Measure may be -- ProcessTaskID / ResourceId}
or you can try same with Pie chart if you required to show.
- Mark as New
- Bookmark
- Subscribe
- Mute
- Subscribe to RSS Feed
- Permalink
- Report Inappropriate Content
ok thanks I will try it
- Mark as New
- Bookmark
- Subscribe
- Mute
- Subscribe to RSS Feed
- Permalink
- Report Inappropriate Content
Hi vijay,
kindly follow the below expression:
=count(Aggr(if(round(sum(worked_hours)/Count(sheet_date))>7,EmployeeID),EmployeeID)) // Occupied
Repeat it for remaining two....
I think it will be useful