Unlock a world of possibilities! Login now and discover the exclusive benefits awaiting you.
- Qlik Community
- :
- All Forums
- :
- QlikView App Dev
- :
- Bug in chart?
- Subscribe to RSS Feed
- Mark Topic as New
- Mark Topic as Read
- Float this Topic for Current User
- Bookmark
- Subscribe
- Mute
- Printer Friendly Page
- Mark as New
- Bookmark
- Subscribe
- Mute
- Subscribe to RSS Feed
- Permalink
- Report Inappropriate Content
Bug in chart?
Hi,
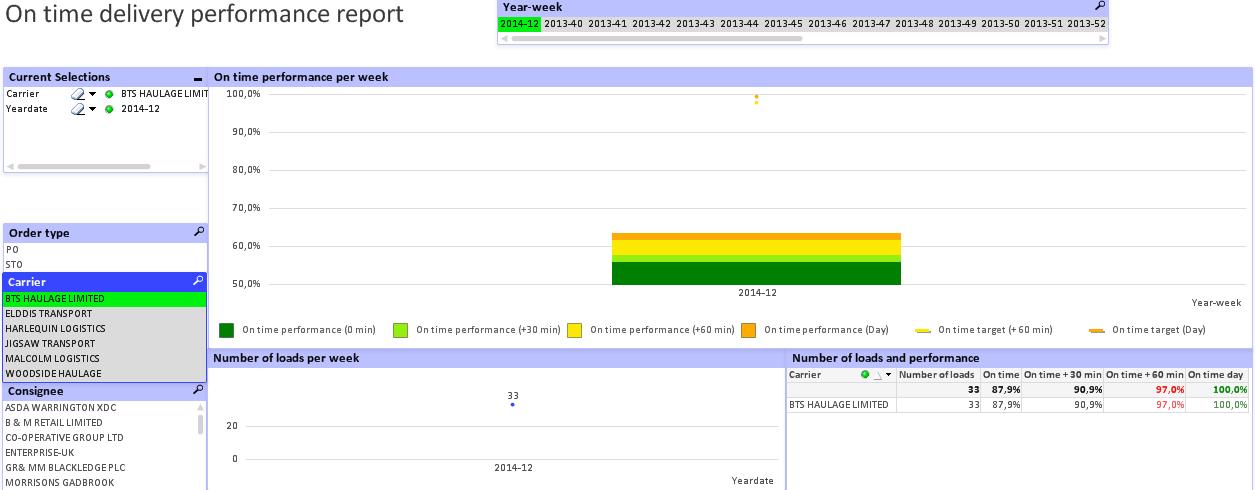
I have a bar chart and a table, which both have exactly the same formula. So for every combination of carrier and week I make, the bar chart and the table show the same data. But for some reason, if I select BTS and week 2014-12 of 2014-13, the data shows a lower percentage in my bar chart. My overall performance for week 12 and 13 is also lower as a result of this. Can anybody help me with this?
Thanks!
Niek
- Mark as New
- Bookmark
- Subscribe
- Mute
- Subscribe to RSS Feed
- Permalink
- Report Inappropriate Content
There's a discrepancy between your chart and table in more than one place, e.g.:
Jigsaw Transport on Week 2013-45 shows an on-time %age of 72.8% in the table, but on hovering over the dark grren portion of the chart it shows 73.2%
I see that there's non-distinct PO Number values in your load details table which might be a cause of variation?