Unlock a world of possibilities! Login now and discover the exclusive benefits awaiting you.
- Qlik Community
- :
- All Forums
- :
- QlikView App Dev
- :
- CYCLE GROUP TITLE NOT SHOWING IN CHART
- Subscribe to RSS Feed
- Mark Topic as New
- Mark Topic as Read
- Float this Topic for Current User
- Bookmark
- Subscribe
- Mute
- Printer Friendly Page
- Mark as New
- Bookmark
- Subscribe
- Mute
- Subscribe to RSS Feed
- Permalink
- Report Inappropriate Content
CYCLE GROUP TITLE NOT SHOWING IN CHART
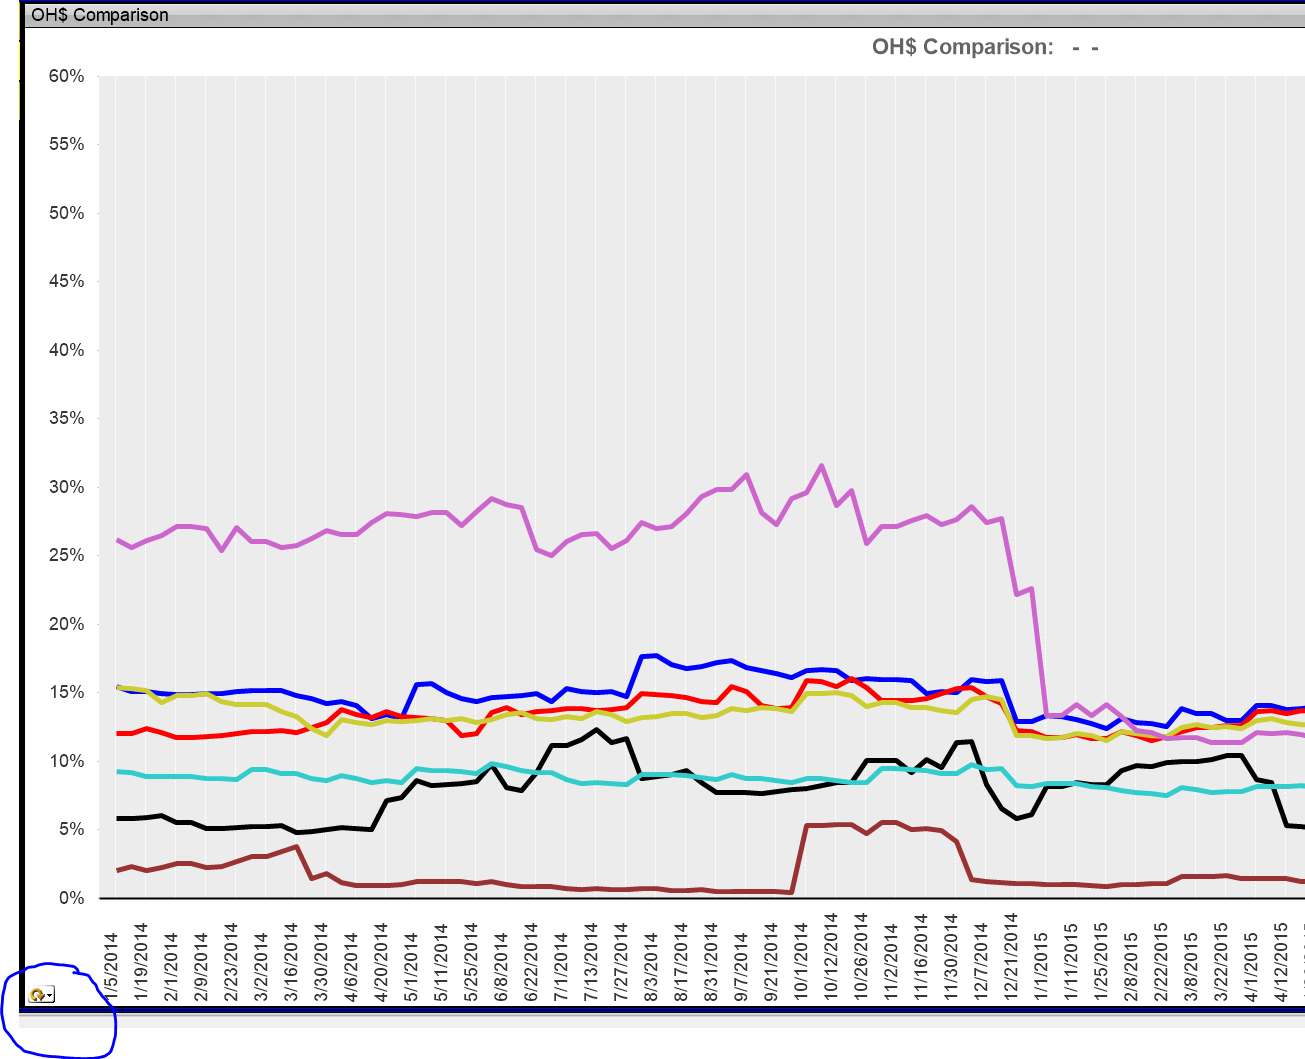
I have a Chart Object with a cycle group in the expressions. I have the OSMI%, Ex12%, and OH$. 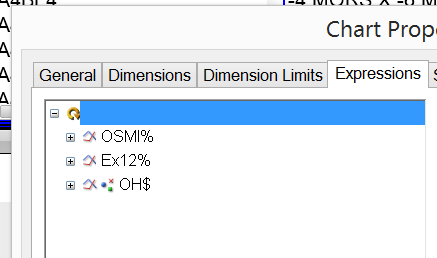
The chart works beautifully except the selected expression doesn't show on the chart. It doesn't tell you what you are looking at - if you select a specific expression from the cycle group there is no way of telling which one you have selected (see bottom left corner of the chart image below)
Is there a way of making it show on the chart? Better yet is there a way of making the current selection show in the TITLE of the chart?
- Mark as New
- Bookmark
- Subscribe
- Mute
- Subscribe to RSS Feed
- Permalink
- Report Inappropriate Content
try go in
Properties->General->Show title in Chart: Enable Show title in chart, and let the value is empty .
- Mark as New
- Bookmark
- Subscribe
- Mute
- Subscribe to RSS Feed
- Permalink
- Report Inappropriate Content
Ps. The title chart will change and not cycle group
- Mark as New
- Bookmark
- Subscribe
- Mute
- Subscribe to RSS Feed
- Permalink
- Report Inappropriate Content
Hi Campbell,
You cant put in your title box in the general tab properties of the graph, something like this:
=OSMI%, Ex12%, OH$: GetCurrentSelections()
And to show the title of the cycle group, you can try to maintain Ctrl+shift and adjust it manually because perhaps Qlikview automatically recognizes that you don't have enough space to show it.
Best regards,
Andrés
- Mark as New
- Bookmark
- Subscribe
- Mute
- Subscribe to RSS Feed
- Permalink
- Report Inappropriate Content
THat worked perfectly
- Mark as New
- Bookmark
- Subscribe
- Mute
- Subscribe to RSS Feed
- Permalink
- Report Inappropriate Content
I have never used "GetCurrentSelections" before. I like it. But it doesn't help.
I cleared out the title and clicked "Show Title" so now at least it shows the cycle group category.
I don't know what you mean about Ctrl+Shift. the icon for the cycle group is TINY and in the bottom left corner of the graph. I would like to make it bigger and show the cycle group selection but I can't seem to figure it out.