Unlock a world of possibilities! Login now and discover the exclusive benefits awaiting you.
- Qlik Community
- :
- All Forums
- :
- QlikView App Dev
- :
- Re: Calculate the change % of a curve
- Subscribe to RSS Feed
- Mark Topic as New
- Mark Topic as Read
- Float this Topic for Current User
- Bookmark
- Subscribe
- Mute
- Printer Friendly Page
- Mark as New
- Bookmark
- Subscribe
- Mute
- Subscribe to RSS Feed
- Permalink
- Report Inappropriate Content
Calculate the change % of a curve
If there was a trend line on the charts how would I be able to determine the improvement or degradation over a specific time period (here it is 52 weeks).
I have a line chart that shows me my safety calculation over 52 weeks (each week I have a new file).
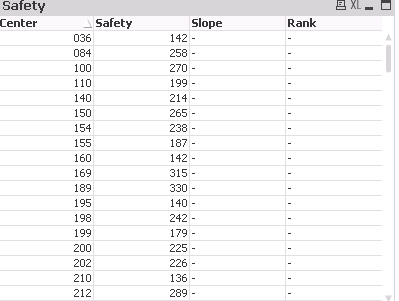
the chart works great and that is not the problem. The problem is I need to create a straight table that has my center (that is easy) my safety calculation (got that), the slope (cant get this to work), and then the rank by the slope (not sure how to do that after I can get the slope to work)
For the slope I tried to follow something I have seen online but all I get is dashes. Any help as to what I need to do to get this working and then how I would get a rank bast on the slope. 1 being the highest number?
I tried this for slope:
LINEST_M(aggr(nodistinct sum(Safety), FileDate, Center), FileDate)
To get the safety I have this and it works.
Avg( {<FileDate = >} ([Total Miles] / (Speeding + Brake + Seatbelt + Accel)))
How do I get the slope to show up in my chart? and then how do I rank by the slope?
- « Previous Replies
-
- 1
- 2
- Next Replies »
- Mark as New
- Bookmark
- Subscribe
- Mute
- Subscribe to RSS Feed
- Permalink
- Report Inappropriate Content
See if this adding TOTAL helps
LINEST_M(TOTAL aggr(nodistinct sum(Safety), FileDate, Center), FileDate)
- Mark as New
- Bookmark
- Subscribe
- Mute
- Subscribe to RSS Feed
- Permalink
- Report Inappropriate Content
Still not getting anything.
- Mark as New
- Bookmark
- Subscribe
- Mute
- Subscribe to RSS Feed
- Permalink
- Report Inappropriate Content
What is safety here? an expression or field?
- Mark as New
- Bookmark
- Subscribe
- Mute
- Subscribe to RSS Feed
- Permalink
- Report Inappropriate Content
What if you replace Safety by {<FileDate = >} ([Total Miles] / (Speeding + Brake + Seatbelt + Accel)) inside your Sum() function (without the Avg) ?
- Mark as New
- Bookmark
- Subscribe
- Mute
- Subscribe to RSS Feed
- Permalink
- Report Inappropriate Content
expression
round(Avg( {<FileDate = >} ([Total Miles] / (Speeding + Brake + Seatbelt + Accel))))
FileDate, Total Miles, Speeding, Brake, Seatbelt, Accel are all dimensions.
- Mark as New
- Bookmark
- Subscribe
- Mute
- Subscribe to RSS Feed
- Permalink
- Report Inappropriate Content
Still getting the same thing.
- Mark as New
- Bookmark
- Subscribe
- Mute
- Subscribe to RSS Feed
- Permalink
- Report Inappropriate Content
How about this
LINEST_M(TOTAL Aggr(NODISTINCT Avg({<FileDate = >} ([Total Miles] / (Speeding + Brake + Seatbelt + Accel))), FileDate, Center), FileDate)
- Mark as New
- Bookmark
- Subscribe
- Mute
- Subscribe to RSS Feed
- Permalink
- Report Inappropriate Content
Still nothing
- Mark as New
- Bookmark
- Subscribe
- Mute
- Subscribe to RSS Feed
- Permalink
- Report Inappropriate Content
Do you mind sharing a sample?
- « Previous Replies
-
- 1
- 2
- Next Replies »