Unlock a world of possibilities! Login now and discover the exclusive benefits awaiting you.
- Qlik Community
- :
- All Forums
- :
- QlikView App Dev
- :
- Calculated percentage in Bar Chart
- Subscribe to RSS Feed
- Mark Topic as New
- Mark Topic as Read
- Float this Topic for Current User
- Bookmark
- Subscribe
- Mute
- Printer Friendly Page
- Mark as New
- Bookmark
- Subscribe
- Mute
- Subscribe to RSS Feed
- Permalink
- Report Inappropriate Content
Calculated percentage in Bar Chart
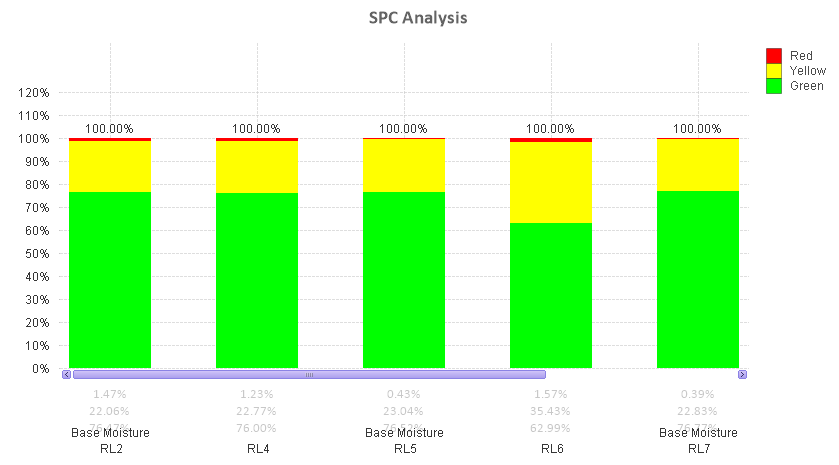
The chart below represents a total count for each of the segmented fields (Green, Yellow, Red). Each of the segments is a calculated dimension. Can someone please help me turn this data into percentages? The Y axis should be 0% - 100% and each segment of each bar should be a percentage thereof. Also, how do you get the numbers to appear in each segment rather than below, on the X axis?
Can someone please help?
Thank you!!

- « Previous Replies
-
- 1
- 2
- Next Replies »
Accepted Solutions
- Mark as New
- Bookmark
- Subscribe
- Mute
- Subscribe to RSS Feed
- Permalink
- Report Inappropriate Content
HI Lee:
I think you should calculate the proportion representing each expression with respect to the total.
Look at the attachment, to see if it is what you want.
- Mark as New
- Bookmark
- Subscribe
- Mute
- Subscribe to RSS Feed
- Permalink
- Report Inappropriate Content
Change your expressions so that they are divided by the sum of all expressions:
Count({<ActualNumeric={">0"}>} If(ActualNumeric>SpLimitLowValue and ActualNumeric<SpLimitUpperValue, ActualNumeric))
/rangesum(
Count({<ActualNumeric={">0"}>} If(ActualNumeric>SpLimitLowValue and ActualNumeric<SpLimitUpperValue, ActualNumeric)),
Count({<ActualNumeric={">0"}>} If(ActualNumeric>Lower_value and ActualNumeric<Upper_value, ActualNumeric)),
Count({<ActualNumeric={">0"}>} If(not (ActualNumeric>SpLimitLowValue and ActualNumeric<SpLimitUpperValue) or
(ActualNumeric>Lower_value and ActualNumeric<Upper_value), ActualNumeric))
)
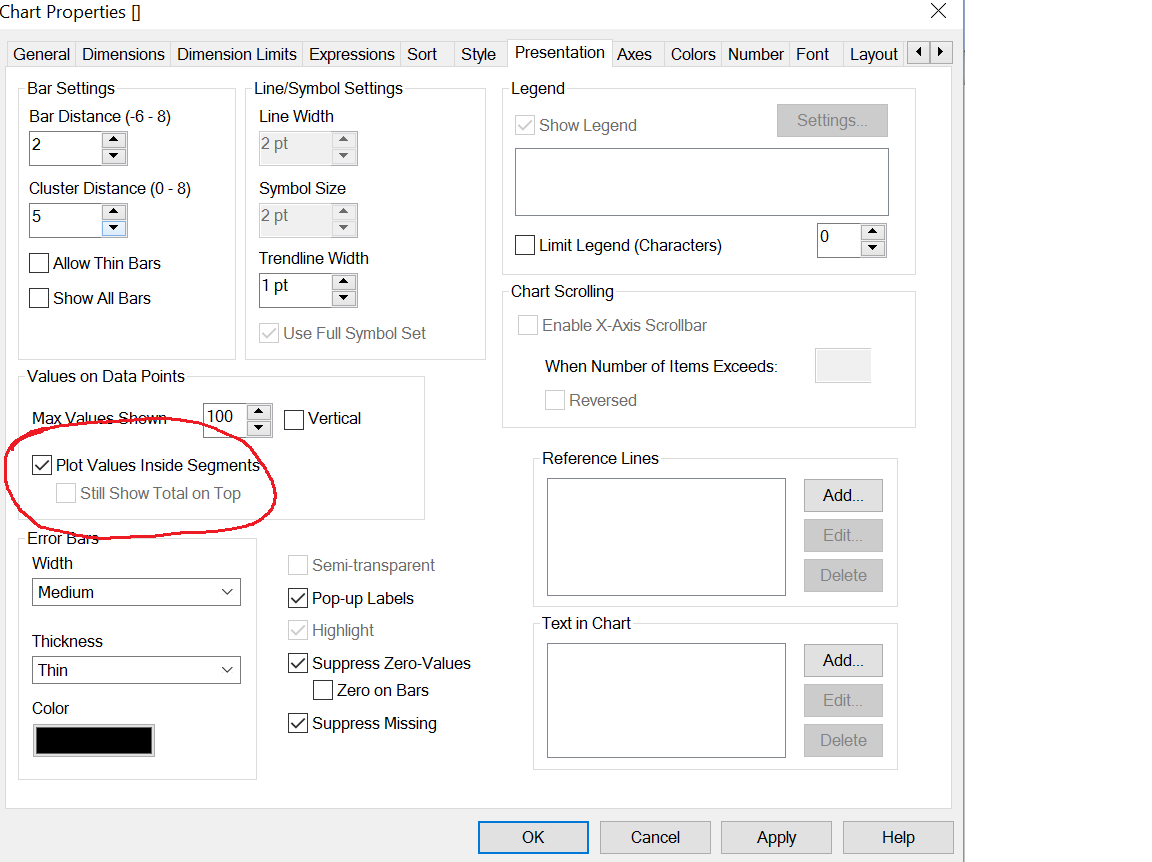
Change the Number format to Fixed to with as many decimals as you want and enable the Show as Percentage option. Disable the Text on Axis option, enable the Values on Data Points option and on the Presentation tab enable the Plot Values in Segments option.
talk is cheap, supply exceeds demand
- Mark as New
- Bookmark
- Subscribe
- Mute
- Subscribe to RSS Feed
- Permalink
- Report Inappropriate Content
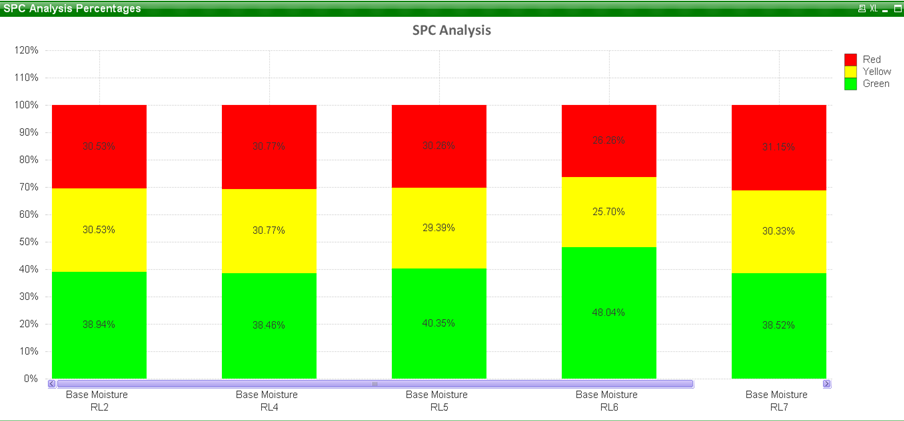
Like this?

- Mark as New
- Bookmark
- Subscribe
- Mute
- Subscribe to RSS Feed
- Permalink
- Report Inappropriate Content
HI Lee:
I think you should calculate the proportion representing each expression with respect to the total.
Look at the attachment, to see if it is what you want.
- Mark as New
- Bookmark
- Subscribe
- Mute
- Subscribe to RSS Feed
- Permalink
- Report Inappropriate Content
Hi Lee, looking the data I think the expressions should use different fields, I have changed it, please take a look:
- Mark as New
- Bookmark
- Subscribe
- Mute
- Subscribe to RSS Feed
- Permalink
- Report Inappropriate Content
Wow that's perfect! Thank you 
- Mark as New
- Bookmark
- Subscribe
- Mute
- Subscribe to RSS Feed
- Permalink
- Report Inappropriate Content
Thank you everyone!!!
- Mark as New
- Bookmark
- Subscribe
- Mute
- Subscribe to RSS Feed
- Permalink
- Report Inappropriate Content
Maria,
How did you get the data points to display on each segment?
- Mark as New
- Bookmark
- Subscribe
- Mute
- Subscribe to RSS Feed
- Permalink
- Report Inappropriate Content
Thanks for your help, but using what you gave me yesterday, I got it right.
- Mark as New
- Bookmark
- Subscribe
- Mute
- Subscribe to RSS Feed
- Permalink
- Report Inappropriate Content
In Properties->Presentation, check the option 'Plot Values Inside Segments'.
- « Previous Replies
-
- 1
- 2
- Next Replies »